People Science · For HR & People Analytics

How to Measure Employee Engagement So the Number Actually Moves

Measuring engagement is the easy part. Most organizations already run a survey, watch turnover, and calculate an eNPS, and most of them can tell you the score without being able to tell you what to do on Monday. Below are 12 ways to measure employee engagement, the scoring formulas, and an honest split of which metrics arrive in time to act on and which only confirm what already happened.

See the 12 Methods ↓ Book a Call Directly →
Customer story below
Azon Recruitment Group
motivator data on 10,000+ people across four generations
When each engagement signal actually arrives
One person · time to resignation

Swipe to see the full timeline →

STILL TIME TO ACT TOO LATE FOR THIS PERSON resignation -6 mo -4 mo -2 mo +2 wk +1 mo motivator gap widens leading · per person · continuous quarterly pulse dips leading, if the cadence lines up absenteeism rises barely leading turnover registers lagging · the event itself exit interview explains why lagging · to someone already gone annual score lagging, and averaged
Leading: moves before the outcome, so you can still change it Lagging: confirms an outcome already decided

How do you measure employee engagement?

Combine three layers. Ask directly, through an annual engagement survey, shorter pulse surveys and eNPS. That gives you a number you can trend. Observe behavior, through turnover, absenteeism, internal mobility and participation rates. This corroborates what the survey claims. Then diagnose the cause, by measuring the gap between what each individual is driven by and what their role currently delivers. The third layer is the one most programs skip, and it is the only one that tells you who is at risk and what to change while there is still time to change it.

Engagement

How much discretionary effort someone is willing to put in, and how invested they are in the outcome. It shows up in whether people raise problems, help colleagues who did not ask, and care how the work lands.

Satisfaction

Whether someone is content with the deal they have. A comfortable employee coasting toward retirement can report high satisfaction. Satisfaction on its own is a poor proxy for engagement and needs its own question set.

Culture

The shared norms and behaviors people operate inside. Culture belongs to the organization, engagement belongs to the individual, and you can find a strong culture in one team sitting next to a weak one. See how to measure organizational culture for that instrument.

Motivation

The underlying driver. Engagement is what you observe on the surface; motivation is the reason it is there or missing. Two equally disengaged people often need opposite interventions. An averaged engagement score cannot tell you that.

Twenty Years of Measurement, and a Second Straight Decline

Engagement has been surveyed diligently across most of the corporate world for two decades. Here is what Gallup's most recent data shows. Worth holding in mind before anyone proposes a second survey.

20%
Of employees worldwide were engaged in 2025, the lowest level since 2020 and the second consecutive annual decline. Gallup puts the peak at 2022-2023, with engagement falling since.
$10T
Approximate cost of low engagement to the world economy in lost productivity, which Gallup puts at around 9% of global GDP.
70%
Gallup put at least this much of the variance in engagement scores across business units down to the manager. It is why a single company-wide score is usually the least useful cut of your own data.
1.7M
Possible combinations of the 11 intrinsic motivators. It's why two people with the same engagement score can need completely different things from you.
Attuned motivator model
The uncomfortable reading

Engagement surveying went from specialist practice to near-universal over the past two decades. Gallup's own global figure peaked in 2022-2023 and has fallen since, reaching 20% in 2025, its second consecutive annual drop. The sharper number sits underneath it: manager engagement fell five points in a single year, from 27% to 22%, the largest year-over-year drop Gallup has recorded, and it is down nine points since 2022. Inside the organizations Gallup calls best-practice, 79% of managers were engaged, nearly quadruple the global average. So the spread has little to do with how much anyone is measuring. Measuring less would help nobody. The useful reading is that the measurement most organizations run is well optimized for reporting a number upward, and poorly suited to telling a specific manager what to do about a specific person on Tuesday. The rest of this page is about closing that distance.

Sound familiar?

Engagement measurement rarely fails at the measuring. It fails in the gap between a number arriving and anybody being able to do something specific with it. That gap looks different depending on where you sit.

The HR Leader With a Beautiful Dashboard

"We measure engagement four times a year. The line has not moved in three."

Your instrumentation is genuinely good. Annual survey, quarterly pulse, eNPS, turnover cut by team and tenure. You present it, everyone nods, a few managers are asked to make a plan, and next cycle the number sits within a point of where it was. The data's real and the reporting's honest. Nothing in it says which person to talk to first.

  • A score that trends flat while individual teams churn underneath it
  • Averages that hide the two teams in trouble
  • Managers who receive a number and no idea what to change
  • Survey fatigue and falling response rates each cycle
  • Action plans that get written, filed, and never revisited
"Our engagement score went from 3.8 to 3.7. I was asked what that meant. The honest answer was that it meant almost nothing, and that the two people I was actually worried about had both scored us fine."
3.7 ? ? ?

The Manager Handed a Team Score

"My team scored 3.7 out of 5. What am I supposed to do with that?"

You got one number for eight people, six weeks after they answered, anonymized so you can't tell who said what. You're told engagement is your responsibility and that 70% of the variance sits with you. Both of those are true. Neither tells you whether the problem is workload, recognition, one person quietly stalling, or a reorg nobody explained.

  • One aggregate number covering people with opposite needs
  • Anonymity that makes the result impossible to act on individually
  • A six-week lag between the answer and the report
  • No way to tell a management problem from a role-fit problem
  • Being held accountable for a metric you cannot decompose
"I was told my team's recognition score was low. I started praising people more in standup. It turned out one person wanted a harder project and found the praise slightly patronizing."

12 Ways to Measure Employee Engagement (and the KPIs Behind Each)

Grouped by what each one does: ask people directly, observe what they do, or diagnose why. Each one is labeled leading or lagging, because that distinction decides whether a metric can change an outcome or can only describe one. A serious program runs several from each group, and most run almost nothing from the third. Together these are the employee engagement KPIs worth tracking, and the practical question is how to track employee engagement continuously without adding another survey.

Group 1: Ask people directly

Self-report. Cheap, scalable, and the backbone of nearly every program. It tells you what people are willing to say, in the window you happened to ask.

1. Annual engagement survey

Lagging · the baseline

Thirty to fifty questions across the drivers you care about, once a year, benchmarked internally and externally. Good for a defensible baseline and board reporting. Weak as an early warning, because by the time it is fielded, cleaned and presented, the conditions it measured have moved on.

2. Pulse surveys

Leading, if the cadence lines up

Three to eight questions, monthly or quarterly, tracking movement between the big surveys. This is where most of the genuine early warning in a survey program lives. Keep the wording identical each cycle or the trend line stops meaning anything.

3. eNPS

Follows its cadence · lagging run annually, leading run with your pulse

"How likely are you to recommend working here?" on a 0 to 10 scale. Its virtue is brevity and comparability. Its limit is that it compresses everything into a single figure with no diagnosis attached, so a falling eNPS tells you to worry without telling you where.

4. A five-question engagement index

Follows its cadence · lagging as an annual composite

A small fixed set covering pride, willingness to recommend, intent to stay, sense of progress and discretionary effort, averaged into one index. Useful because it is stable across cycles and quick to answer. Formula is in the scoring section below.

Group 2: Observe what people do

Behavioral data you already hold in your HRIS. Its value is corroboration: it catches the gap between what people say on a survey and how they behave.

5. Turnover and retention rate

Lagging · the outcome itself

Split voluntary from involuntary, and regretted from unregretted, or the number means very little. Regretted voluntary turnover by manager is the single most honest engagement metric most organizations already have. It is also, by definition, too late for everyone in it.

6. Absenteeism and unplanned leave

Barely leading

Rising unplanned absence in a specific team is a real signal, and it typically appears only weeks before a resignation. Treat a team-level shift as worth investigating and resist reading individual patterns as motive, since illness and caring responsibilities look identical in the data.

7. Internal mobility and promotion rate

Leading · slow but real

How many roles you fill internally, and how long people wait for a move. A team where nobody has progressed in two years is generating flight risk whatever its survey score says. This is one of the few HRIS metrics that moves before the damage.

8. Participation and discretionary effort

Leading · the cheapest signal you own

Survey response rates, volunteering for optional work, attendance at things nobody is required to attend, referrals of friends. Referral rate in particular is people voting with their reputation. A falling response rate is itself an engagement finding, so record it as a finding in its own right.

Two more worth naming here. Focus groups sit between asking and diagnosing: a facilitated session with 6 to 10 people surfaces the reasoning behind a survey result that no scale can capture, and works best when someone outside the reporting line runs it. Manager effectiveness scores roll the manager-specific survey items into their own metric, which matters because Gallup attributed at least 70% of the variance across business units to the manager. Track it per manager and it earns its place next to turnover.

Group 3: Diagnose the cause

The layer that turns a score into an action. This group is where nearly every engagement program is thin, and it is the reason so many of them report faithfully for years without moving the number.

9. One-on-ones and skip-levels

Leading · qualitative

The highest-resolution instrument you have, and the least systematic. Structured prompts make it comparable over time: see our one on one meeting questions and skip-level meeting questions for question sets designed to surface what a survey rounds off.

10. Stay interviews

Leading · the underused one

A deliberate conversation with the people you most want to keep, while you still have them, about what would make them leave. Structurally the same honesty an exit interview gets, arriving while it is still actionable. Our stay interview questions cover the format.

11. Exit interviews

Lagging · useful in aggregate

Candid and too late, individually. In aggregate across twenty departures the themes are a genuine diagnosis of what your organization keeps failing to provide. Use our exit interview questions template and read the results as a pattern.

12. Motivator-gap tracking

Leading · per person · continuous

Measure what each individual is intrinsically driven by, then track how satisfied each of those drivers currently is. The gap between the two moves months before turnover or absenteeism, and it is individual, so it names a person and a cause, where an average names nobody. This is what Attuned's intrinsic motivation assessment measures.

Lagging vs Leading Engagement Metrics

A lagging indicator confirms something that already happened. A leading indicator moves before the outcome, and that is the only kind you can act on. Most engagement programs are heavily weighted toward the left column, which explains how an organization can measure diligently for years while the number stays flat. One caveat worth stating plainly: what makes a survey leading or lagging is mostly its cadence. The same five questions asked once a year describe the past, and asked quarterly they hint at the future. Frequency is the lever, and the choice of instrument comes second.

How the two behave differently
  Lagging Leading
Examples Turnover, exit themes, annual score, eNPS, the five-question index Pulse movement, absenteeism shifts, internal mobility, discretionary effort, motivator gap
What it tells you What already happened, and roughly why What is about to happen, and to whom
Resolution Company or team average Team, and at best the individual
Timing Weeks to months after the fact Weeks to months before it
Best used for Board reporting, benchmarking, proving the cost Deciding who to talk to this week and about what
Failure mode Diligent reporting, flat trend line Acting on noise, or measuring more than you can follow up

eNPS and the five-question index sit on the left because most organizations run them once a year. Run either one quarterly and both move right. That is the cadence point, applied.

A practical ratio

You need both columns. The lagging set is how you prove the cost of the problem and hold a benchmark, and no board will accept a business case without it. The leading set is how you actually change next year's lagging number. If you audit your current program and find every metric in it sits on the left, that is the finding, and adding one leading measure will do more than refining the survey wording for a fourth time.

How to Calculate an Employee Engagement Score

There are three formulas worth knowing, and the only rule that matters across all of them is that you freeze the method and the question wording. Changing either mid-program is the most common way organizations accidentally destroy their own trend line.

Three standard engagement scoring methods, with worked examples
1. PERCENTAGE FAVORABLE   (the most common)

   favorable responses (4 or 5 on a 5-point scale)
   ------------------------------------------------  x 100
                total responses

   Worked example: 340 of 500 responses were 4 or 5
   340 / 500 x 100 = 68% favorable

   Convention we use: 70-80% favorable is a good result.


2. MEAN SCORE   (keeps more information)

   sum of all response values
   ---------------------------
      number of responses

   Worked example: 1,850 total points across 500 responses
   1,850 / 500 = 3.70 out of 5

   Convention we use: 4.0+ strong, 3.5-4.0 healthy, under 3.5 investigate.


3. eNPS   (one question, -100 to +100)

   % promoters (score 9-10)  minus  % detractors (score 0-6)

   Worked example: 45% promoters, 20% detractors
   45 - 20 = eNPS of +25

   Convention we use: above 0 net positive, above 20 good, above 50 rare.
   Note: those scoring 7-8 are passives and are excluded by design.


ENGAGEMENT INDEX (5 questions, averaged, tracked over time)
   Score each 1-5, then take the mean of the five means:
     - I am proud to work here                        (pride)
     - I would recommend this as a place to work      (advocacy)
     - I rarely think about looking elsewhere         (intent to stay)
     - I am making progress on things that matter     (progress)
     - I willingly put in extra effort when needed    (discretionary effort)

On thresholds: there is no industry-standard cut-off, and any vendor quoting one is quoting itself. The bands above are the convention we use with customers, offered as convention and not as research. Your own trend line and the spread between your teams matter more than any external number.

Whichever you choose, report the distribution and the spread between teams alongside the headline figure. A company mean of 3.7 covering teams that range from 2.9 to 4.6 is a completely different situation from every team sitting at 3.7, and the single number describes both identically.

What the Score Is Made Of

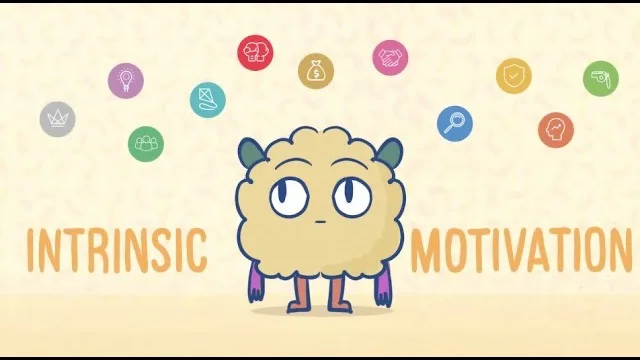
Engagement is a surface reading of something underneath it. Two people with identical scores can be there for opposite reasons and need opposite responses. This 5-minute video explains intrinsic versus extrinsic motivation. That is the layer a survey average flattens.

Attuned explainer: intrinsic vs extrinsic motivation, with the 11 motivator icons around the Attuned mascot
Attuned · YouTube
Intrinsic vs. Extrinsic Motivation, and Why the Average Hides It
Click to play, loads YouTube only after you click

A seismograph has never once
prevented an earthquake.

It was never built to. It's a beautifully engineered instrument for recording, with great precision, a movement that already happened. Plenty of engagement dashboards are seismographs: exquisitely calibrated, faithfully logging the shock after the ground moved, and quietly mistaken by their owners for an early-warning system. The instrument is fine. The expectation is what needs adjusting.

20%
of employees worldwide were engaged in 2025, the lowest Gallup has recorded since 2020, after two decades of near-universal engagement surveying. Gallup, State of the Global Workplace
Research Insight

Psychologist Adam Mastroianni has written that "How are you?" is a ritual question that expects a ritual answer. Both parties understand: what is being exchanged is a performance of connection, not connection itself. An engagement survey is that exchange, formalized, anonymized and scaled to a whole organization. It asks 500 people a version of "how are you?" and then averages the ritual answers into a decimal.

Adam Mastroianni, Experimental History

Measure the inputs that produce it

Engagement is an output. What produces it is the fit between what a person is intrinsically driven by and what their role delivers, day to day. Measure that fit directly, per person, and you get a reading that moves months before turnover, absenteeism or the next survey cycle, and that names an individual and a cause, at a resolution an average cannot reach.

Attuned maps every person across 11 intrinsic motivators, then tracks how satisfied each of those drivers is over time. A high-Progress person whose work has flattened shows up as a widening gap long before their eNPS answer moves. It pairs with our employee retention software so the reading reaches a conversation, the one place it can do something.

  • Per-person resolution, so a low score has a name attached
  • A leading signal, readable while there is still time to act
  • Separates a management problem from a role-fit problem
  • Turns each gap into a specific prompt for the next check-in

There is a related principle in instrumentation: reading the thermometer more often has no effect whatsoever on the temperature. Engagement programs rediscover this annually, usually around the point where somebody proposes adding a third survey.

The same team score, decomposed to the individual
What the survey reported
T
Team of 8
Engagement index 3.7 / 5 · "slightly below target"
Overall 3.7
Recognition 2.9
Growth 3.1

Two low drivers, eight people, no names. The standard response is to praise more and publish a development framework. It will land correctly for some of these eight and miss the rest.

What the motivator gap showed
“Two of the eight are driving that score, for opposite reasons. Neither needs more praise.”

Priya scores high on Progress and low on Status. Her work has repeated for three quarters. She wants a harder problem, and public recognition reads to her as a consolation prize.

Marcus scores high on Status and high on Feedback. He has delivered the team's hardest work twice and nobody senior noticed. He needs visibility, specifically from above his manager.

A single team-level "improve recognition" action would have half-worked for Marcus and actively irritated Priya. That's what an average costs you.

4 Reasons Engagement Measurement Fails to Change Anything

Each of these is a design flaw in the measurement, and no amount of effort fixes a design flaw. Organizations that fix them usually do it without buying another survey.

01

The average erases the signal

Eight people averaging 3.7 can be eight people at 3.7 or six at 4.2 and two at 2.1. Those demand completely different responses, and the headline figure presents them identically. Report the spread and the distribution alongside the mean, always.

02

The lag outruns the usefulness

Field in March, clean and analyze through April, present in May, cascade to managers in June. By the time a manager can act, the person who answered has had three months of new experience, and possibly an offer.

03

Anonymity blocks the follow-up

Anonymity is what buys you honest answers, and it also means nobody can act individually on what those answers reveal. That tension is real and unavoidable in a survey. A survey alone can't be the whole program.

04

Measuring substitutes for acting

Running the survey feels like addressing engagement, so that's where the effort concentrates. The predictable result is a mature measurement function, a thin action function, and a flat trend line that everybody can explain and nobody can move.

What to Do When Your Engagement Score Drops

The instinct is to announce something company-wide. That reliably produces motion without improvement. Six steps that work better, in order.

1. Disaggregate before you interpret

A falling company average is almost always a few teams moving sharply, and not everyone drifting slightly. Cut by team, manager, tenure band and location first. Frequently the "engagement problem" turns out to live in two teams and one recent reorg.

2. Separate the driver from the symptom

A low recognition score can mean a manager who never says thank you, or a person with a high Status driver in a role with no visibility. Those need opposite fixes, and choosing wrong is worse than doing nothing, because it burns the credibility of your next attempt.

3. Go and ask, specifically

Survey data tells you where to point a conversation. Take the two lowest drivers into structured one-on-ones and ask about them directly with concrete examples. Ten good conversations beat a follow-up survey, and they arrive faster.

4. One change per team, with an owner

Pick the single thing that team said mattered most, name who owns it, and set a date. Five simultaneous initiatives dilute into none. One visible completed change does more for next cycle's response rate than any amount of communication about the survey.

5. Close the loop out loud

Tell people what you heard, what you are changing, and what you decided against and why. "We looked at this and are not changing it, here is the reason" preserves far more trust than silence. Silence is what teaches people their answers went nowhere.

6. Add one leading measure

If the audit showed every metric you hold is lagging, that's the actual finding. Add one forward-looking measure at individual resolution so next cycle you are reacting to a drift signal, ahead of any confirmed decline.

The test worth applying

Before you commission any new engagement measurement, ask what decision the result will change and who will make it. If the honest answer is that it'll be reported and discussed, you're buying reporting. If the answer names a person, a decision and a deadline, you are buying measurement. The second one moves numbers. The first produces very good slides. Our guide to barriers to employee engagement covers what usually sits behind a stubborn score.

From an averaged score to a per-person reading, in under a week

How an organization goes from a quarterly number nobody can act on to a continuous, individual-level measure of the gap between what each person values and what their role delivers.

Step 0 · Start Here

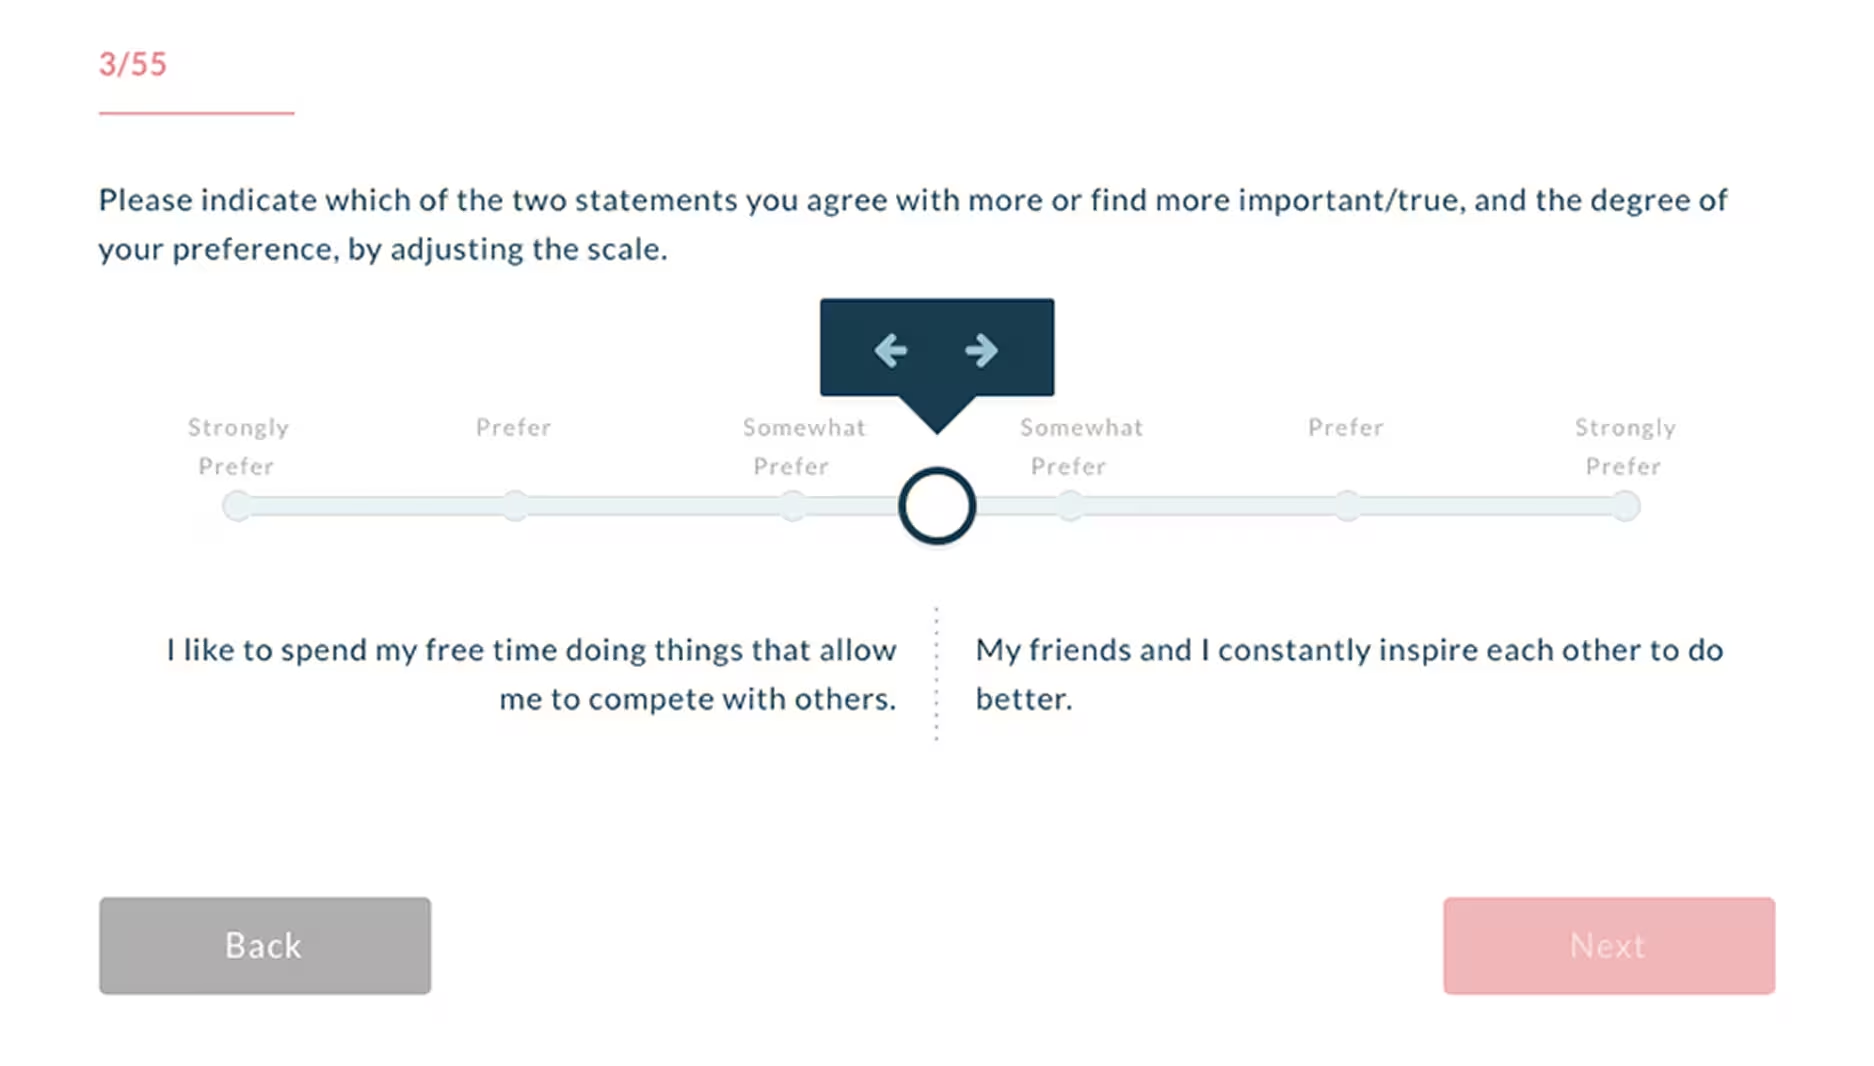
Everyone completes a ~10-minute assessment. That's the whole setup.

No rollout plan. No IT project. Each member answers a simple set of questions, and Attuned automatically calculates their profile across 11 intrinsic motivators. Most teams are up and running within a week of signing up.

Slider-based questions, ~10 min

Attuned motivator assessment screen with slider-based questions
~10 minper member
11motivators measured
1.7Mpossible profiles
Week 1baseline in place
01
Establish the Baseline

Measure what each person is driven by

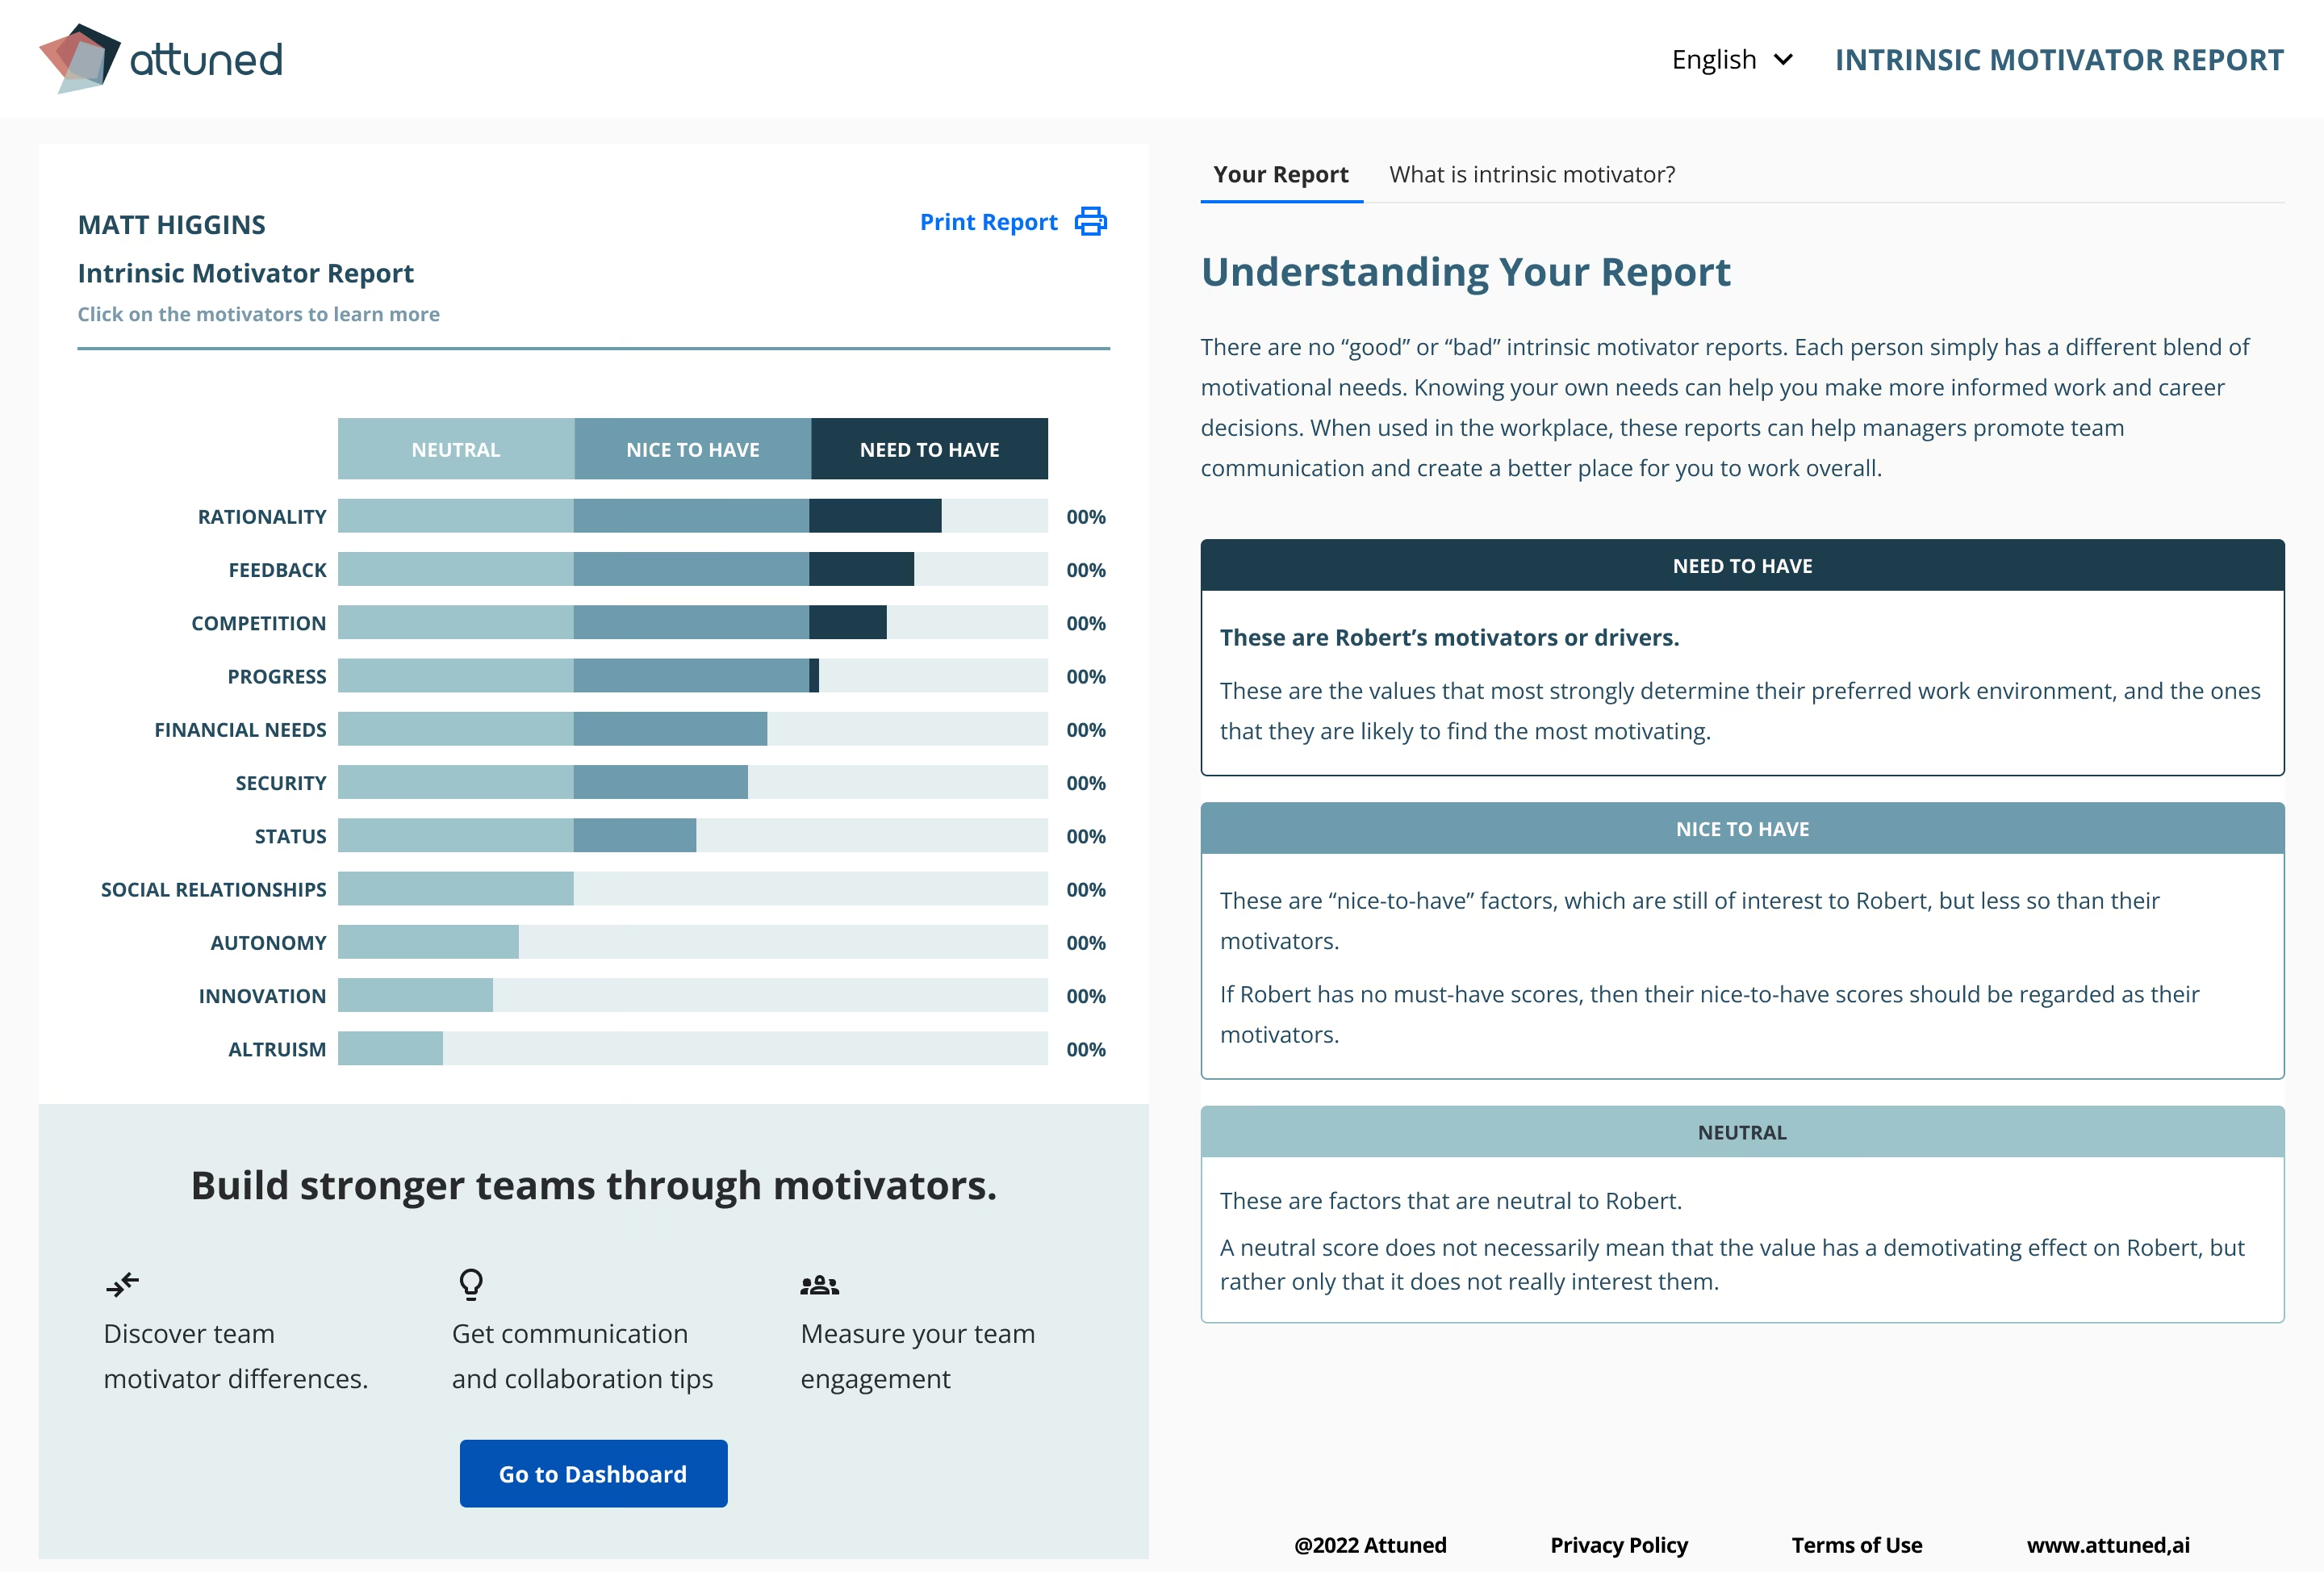
Every person gets a profile across 11 motivators, so you know what "engaged" would actually have to mean for each of them. That baseline is what makes a later change in satisfaction interpretable at all.

11 motivator dimensions One profile per person
Motivator profile generated immediately
Attuned motivator breakdown showing a team member's intrinsic motivator profile and which drivers are going unmet
02
Measure the Gap

Track satisfaction per driver, per person

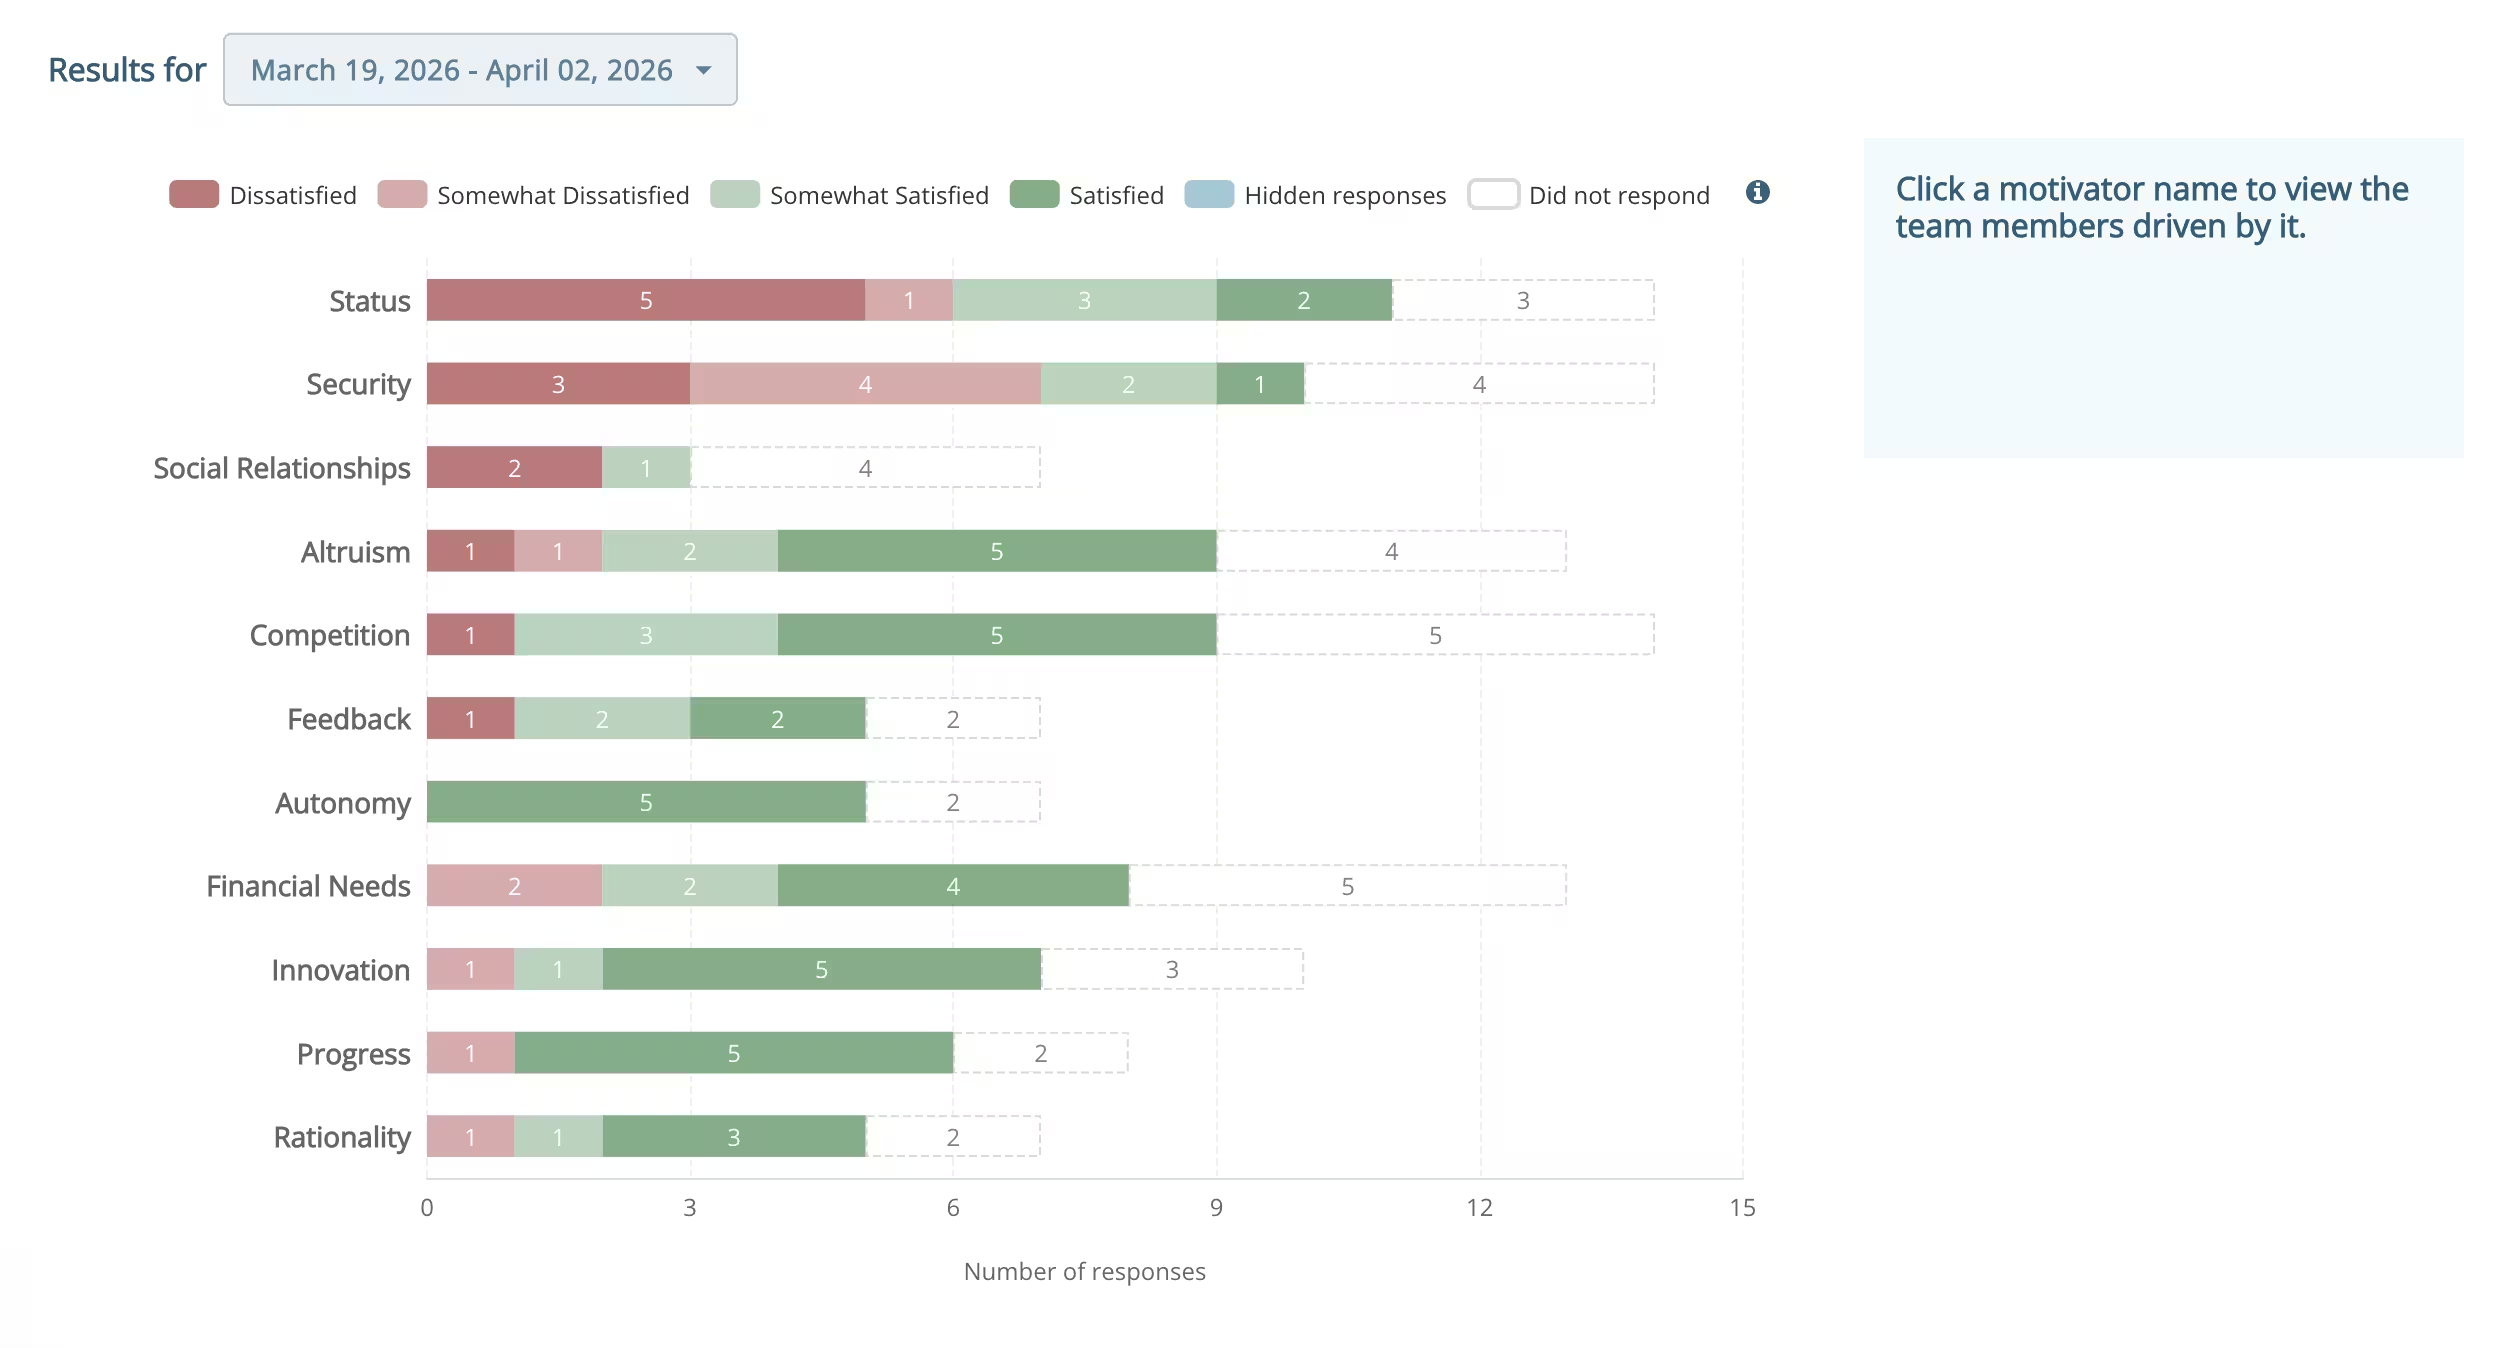
Attuned then measures how satisfied each of those 11 drivers currently is, so you can see the distance between what someone values and what the role delivers. That distance is the leading indicator, and it is visible across the whole group at once.

Value-vs-role gap map Guidance on what to change
Detailed breakdown · member responses by top motivators
Measuring employee engagement at individual resolution: the Attuned Detailed Breakdown dashboard, with a stacked satisfaction bar for each of the 11 intrinsic motivators so a leader can see which drivers are going unmet
03
Watch It Move

See drift before the lagging metrics catch it

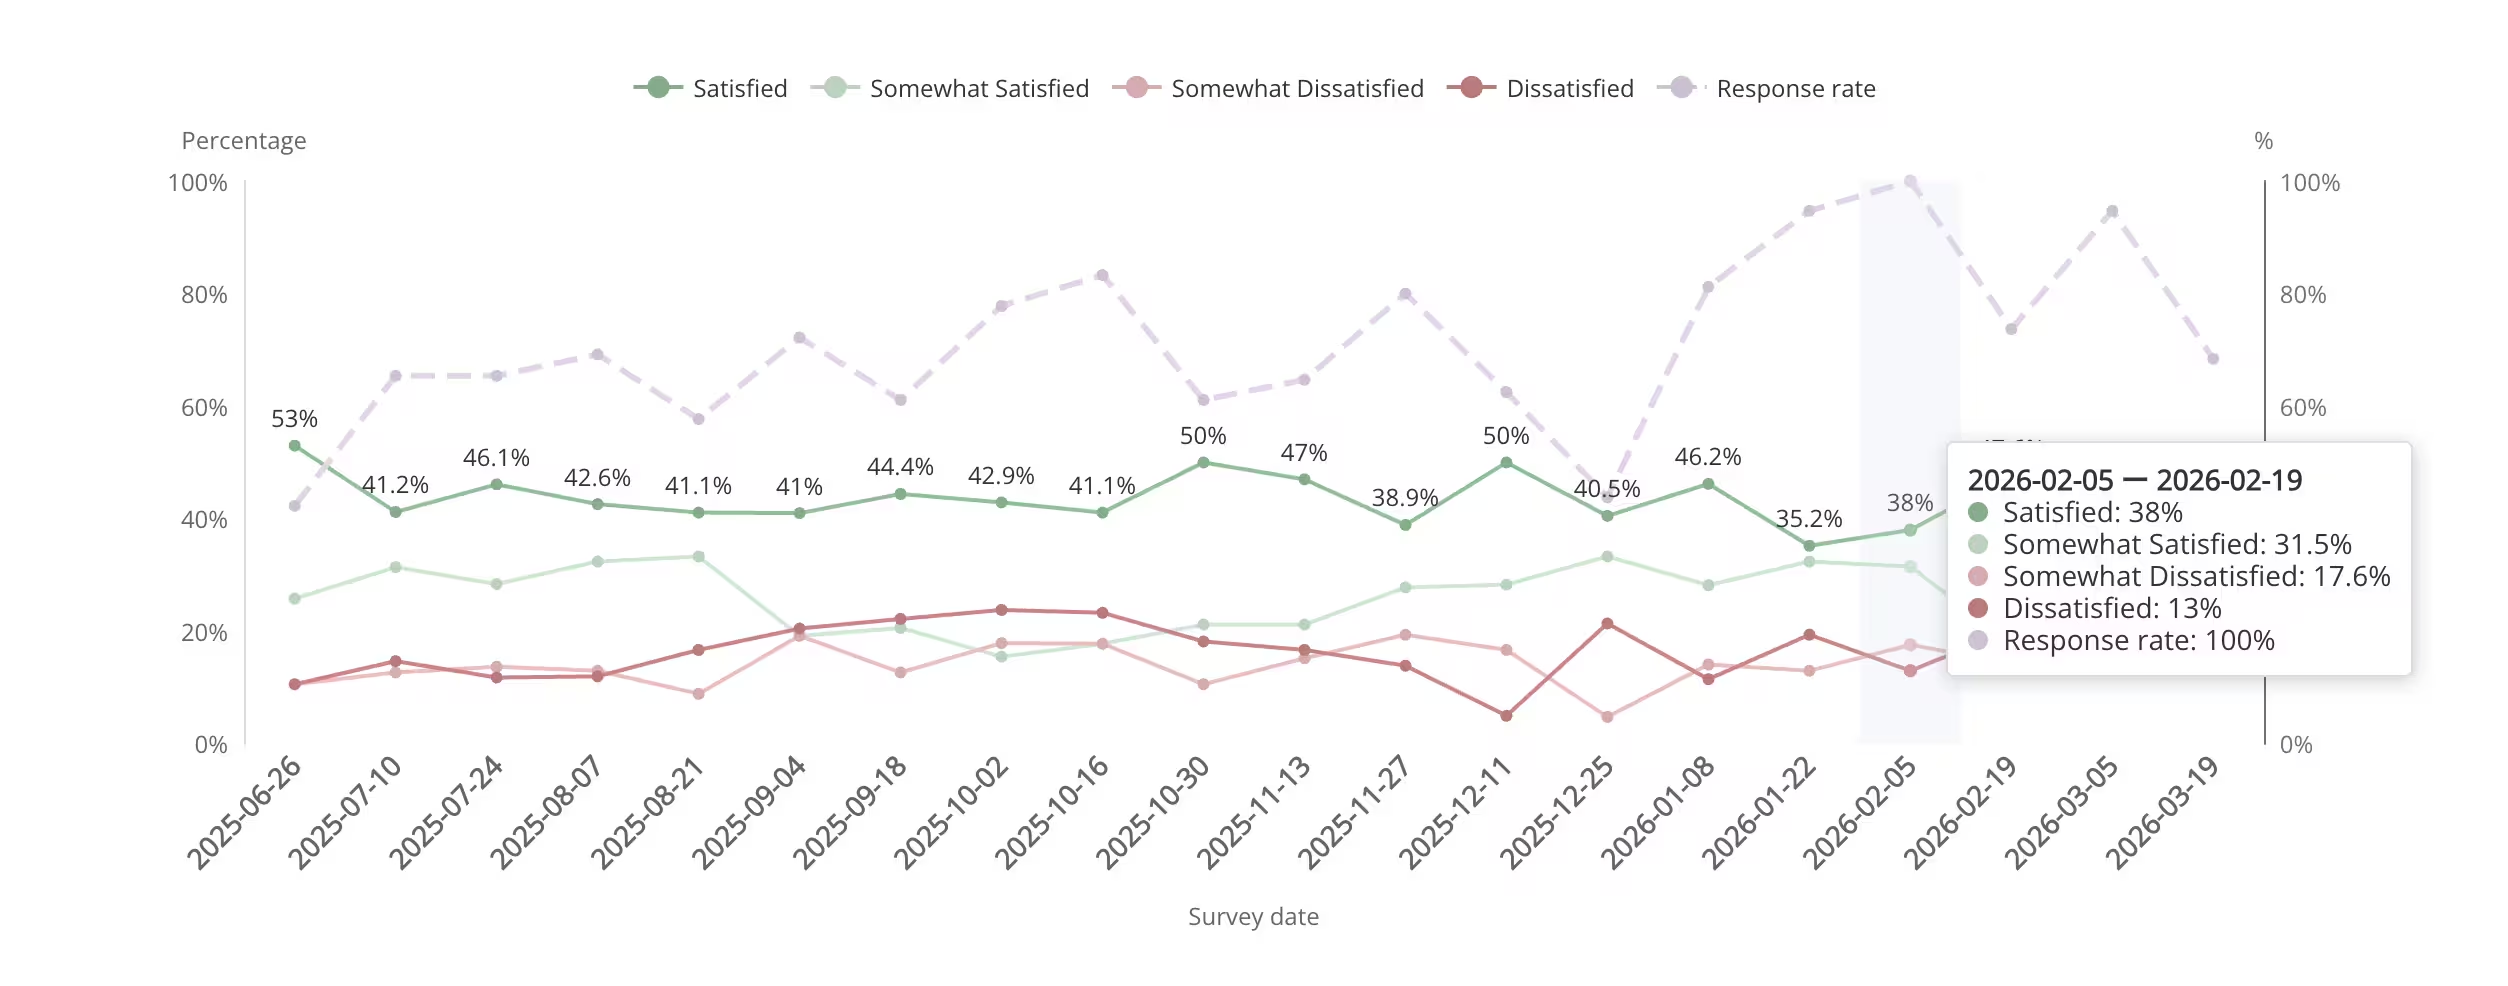
Motivator satisfaction is tracked continuously, so a widening gap surfaces months before it shows up in absenteeism or a resignation. This is the part of the timeline at the top of this page where there is still something you can do.

Early-warning drift alerts Continuous tracking
Motivator satisfaction tracked over time
Attuned dashboard tracking motivator satisfaction over time and flagging the member whose motivators are going unmet before they leave
04
Close the Action Gap

Turn the reading into the next conversation

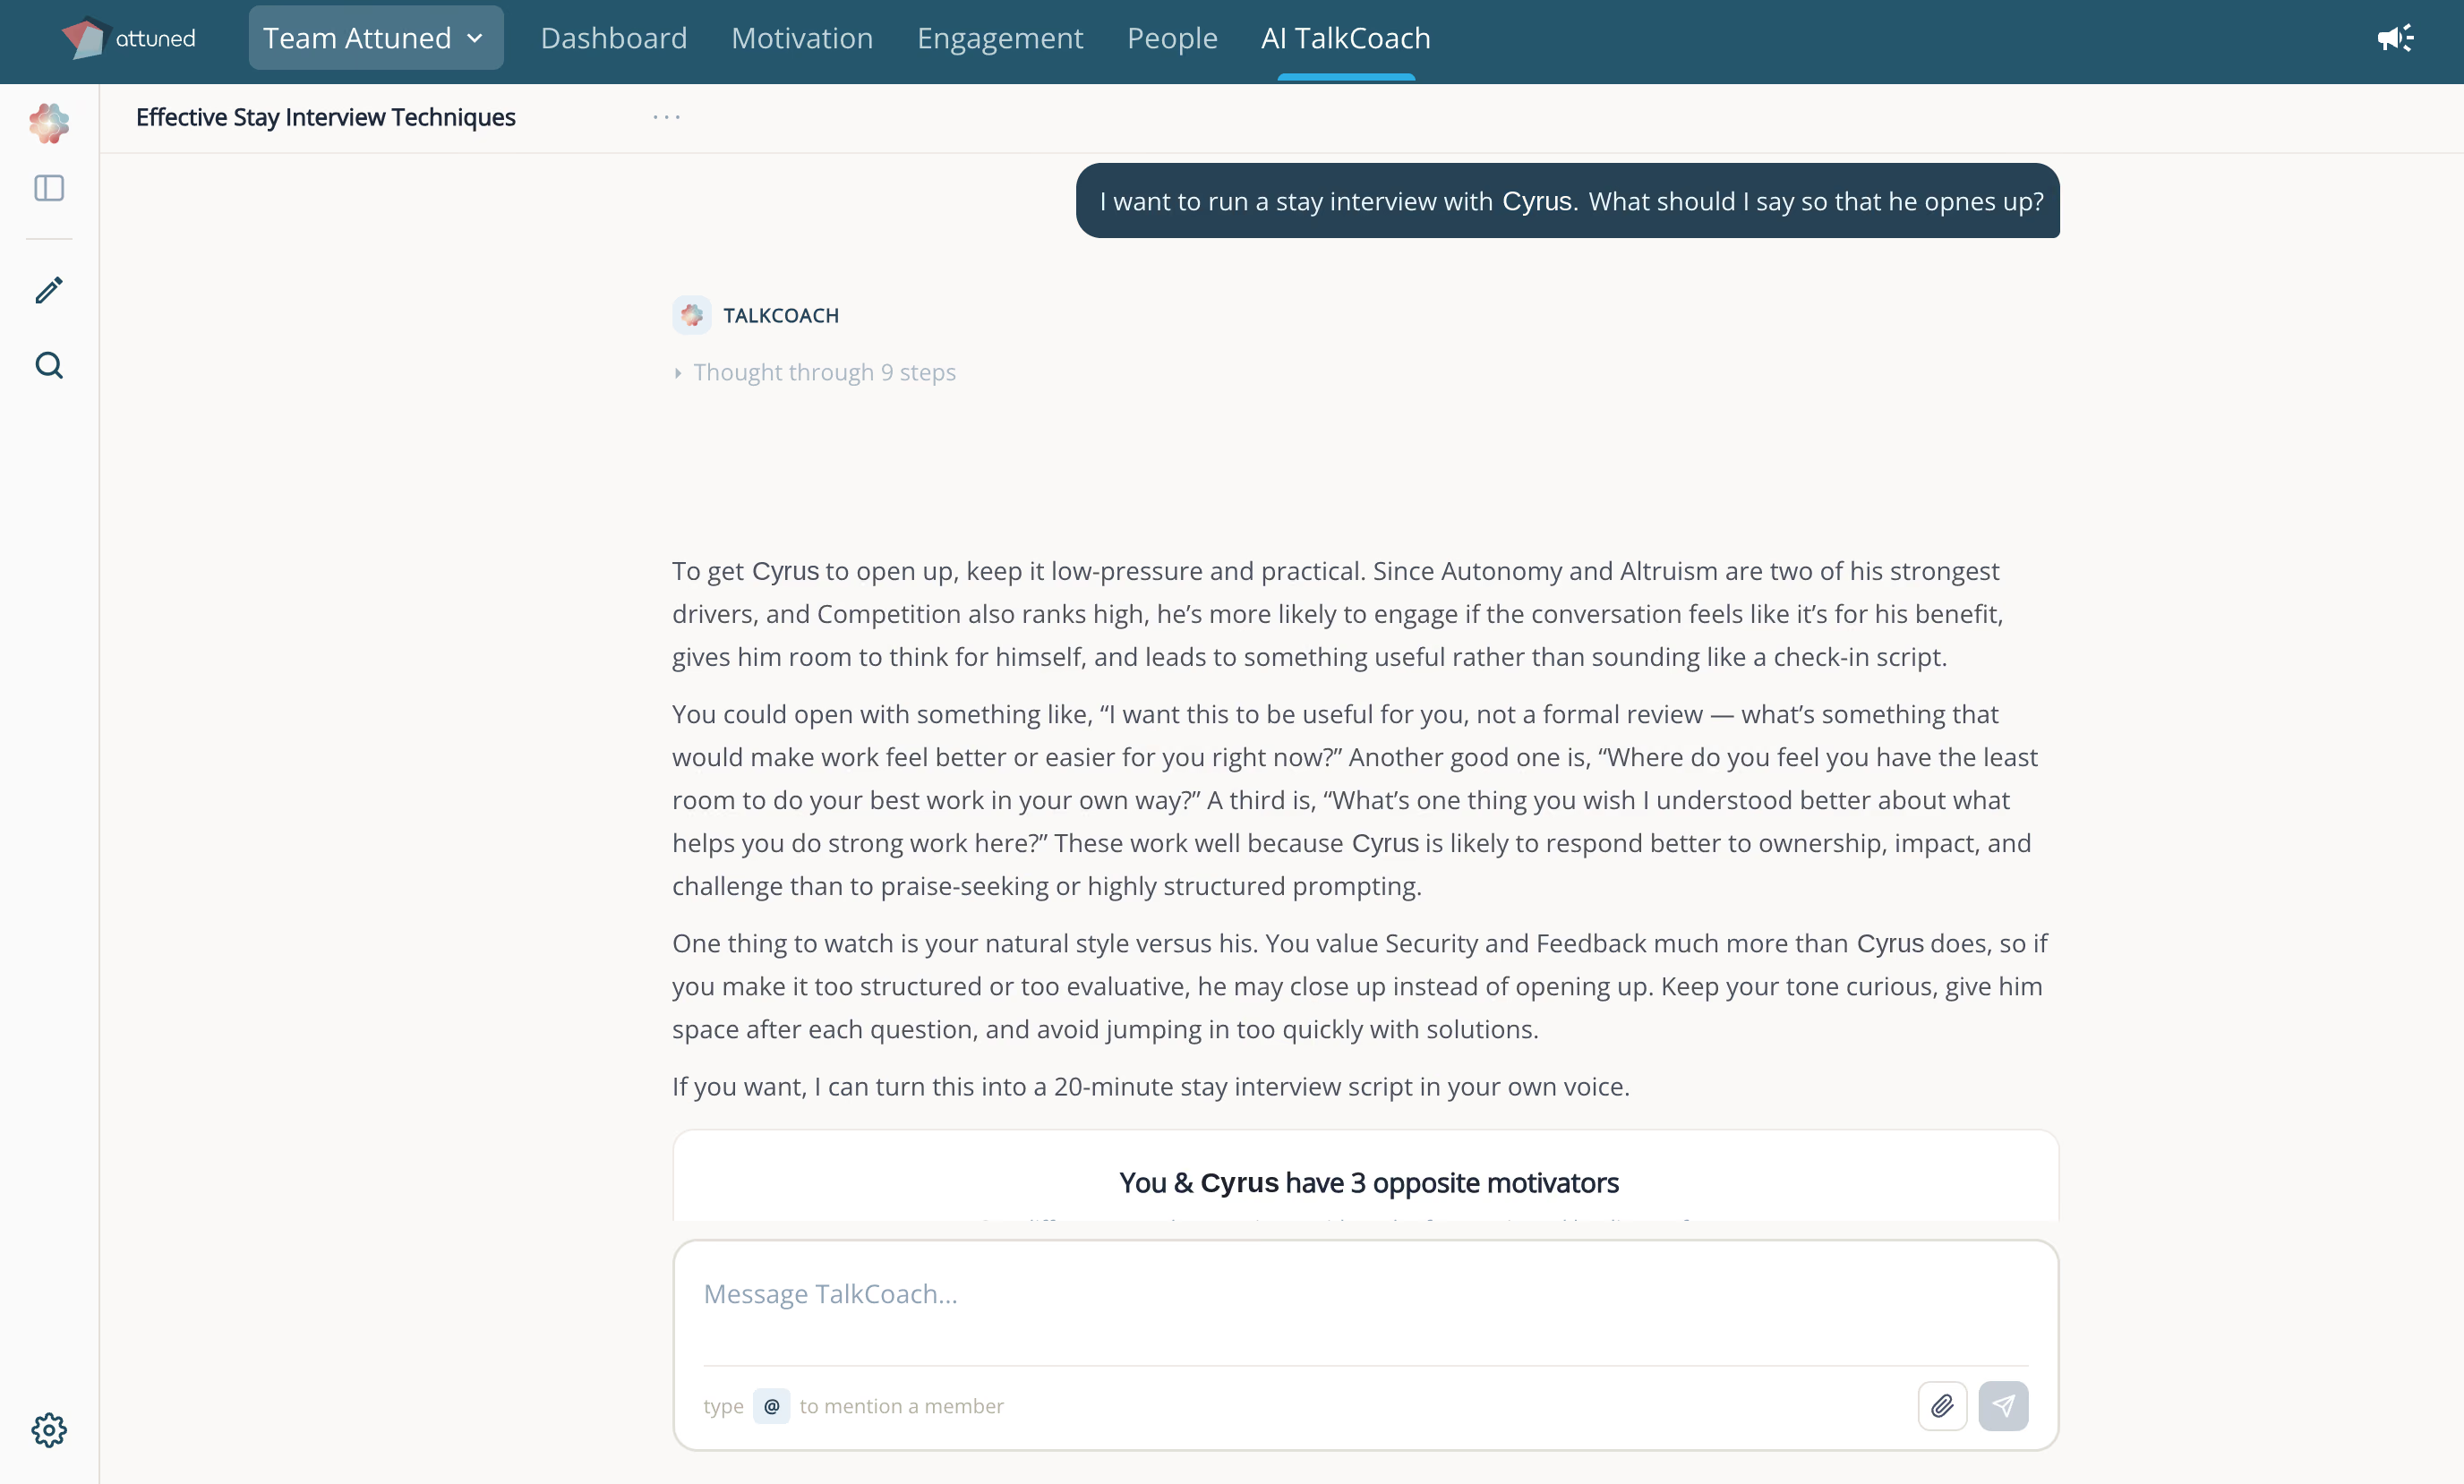
The AI TalkCoach converts each person's profile and current gaps into what to ask, how to frame it, and what to avoid. This is the step that separates measurement from reporting: the manager receives a specific prompt for a specific person, where the old flow handed over a team score and an instruction to make a plan.

AI coaching per person Ready-to-use prompts
AI TalkCoach · suggested conversation prompts
Attuned AI TalkCoach turning a team member's motivator profile and current gaps into a suggested prompt for the manager's next conversation
Measuring diligently and moving nothing?
Add one leading, individual-level measure in under a week.
No IT project. Your team is profiled and you can see which specific person is drifting, and on which driver, before Friday.
Book a Call Directly →
Book a time that works for you · No callback queue

How a Growing Firm Replaced Instinct With a Measurement

Azon Recruitment Group grew from a small team into an award-winning business and hit the limit every scaling company hits: reading the mood of the room stops working once there are too many rooms. Their answer was individual motivator data. A bigger survey would not have found it.

Azon Recruitment Group team, a fast-growing firm that replaced instinct about engagement with individual motivator measurement, with Attuned

Resources for Measuring and Then Moving the Number

The instruments referenced throughout this page, plus the research we build on.

The State of Motivation Report

Our annual research on what drives people at work, from over 10,000 users across four generations. Useful context for interpreting your own scores.

Read the 2026 report →

Psychological Safety Workbook

Whether your survey gets honest answers at all is a psychological safety question. This covers how to build it and how to measure whether you have.

Get the workbook →

How to Measure Organizational Culture

Culture and engagement are different properties needing different instruments. This is the companion page for the culture side.

Measure culture →

Stay Interview Questions

The leading-indicator conversation most programs skip: asking your best people what would make them leave, while you still have them.

See the questions →

Signs of Quiet Quitting

What disengagement looks like behaviorally, before it reaches any of your dashboards.

Read the signs →

Why 1-on-1s Fail

The top five reasons the highest-resolution engagement instrument you own quietly stops working.

Read the post →

Everyone can measure engagement. Knowing which person to talk to on Monday is the hard part.

Survey platforms are mature and mostly very good at producing a defensible number. What's missing is the layer underneath: which individual is drifting, on which driver, and what to say to them. That is the part Attuned measures, and it is what turns a reporting function into a change in next year's score.

Up and running in a week

A ~10-minute assessment. No IT project, no manager training required. Your whole team can be measured within days of signing up.

Individual, down to the person

11 intrinsic motivators per person. By the time you are reading it, you already know which of the eight you need to talk to, and about what.

AI coaching for every manager

The AI TalkCoach turns each gap into what to ask and what to avoid, closing the distance between a finding and a conversation.

GDPR-compliant by design

Lawful basis, data minimization, individual access rights, and the right to be forgotten. Your people own their motivator data.

Measuring Employee Engagement: Common Questions

How do you measure employee engagement?
Combine three layers. Ask directly through an annual engagement survey, shorter pulse surveys and eNPS. That gives you a number you can trend. Read behavior through turnover, absenteeism, internal mobility, discretionary effort and participation rates. These corroborate the survey. Then go one level deeper and measure the gap between what each individual is driven by and what their role currently delivers. Only that third layer tells you who is at risk and what to change while you can still do something about it. Most engagement programs stop after the first two layers. That's why the score moves and nobody knows what to do next. The 12 methods above are grouped exactly that way.
What is a good employee engagement score?
There is no industry-standard threshold here, and any vendor quoting one is quoting itself. The bands we use with customers, offered as convention: on a five-point mean, 4.0 and above is strong, 3.5 to 4.0 healthy, and below 3.5 worth investigating. On percentage favorable, 70% to 80% is a good result. On eNPS, above zero is net positive, above 20 good, and above 50 rare. Two cautions: the absolute number matters far less than its direction over time and the spread between your teams, and a high average routinely hides a team or an individual in trouble. Global engagement was 20% in 2025 by Gallup's measure, so treat external benchmarks as a floor and set your own target above them.
How do you calculate an employee engagement score?
The two standard methods are percentage favorable and the mean score. For percentage favorable, count the responses that are 4 or 5 on a five-point scale, divide by total responses and multiply by 100. For the mean, add every response value and divide by the number of responses, then report it against the same scale each cycle. eNPS is calculated separately: subtract the percentage of detractors, who score 0 to 6, from the percentage of promoters, who score 9 to 10, giving a range from minus 100 to plus 100. Whichever you pick, freeze the method and the question wording, because changing either mid-program makes your trend line meaningless. Worked examples for all three are in the scoring section.
What is the difference between a leading and a lagging engagement indicator?
A lagging indicator confirms something that already happened: turnover, absenteeism, exit interview themes and last quarter's survey score all describe a state you can no longer influence for the people involved. A leading indicator moves before the outcome does, so you still have room to act. Most engagement measurement is heavily weighted toward lagging metrics. It is why programs can report diligently for years while the number stays flat. The practical fix is to keep the lagging set for corroboration and add at least one leading measure, such as the gap between what an individual values and what their role currently gives them, tracked per person over time. The comparison table above sets the two side by side.
How often should you measure employee engagement?
A common rhythm is one full engagement survey a year, a shorter pulse every quarter, and continuous signals in between. Going faster than quarterly with a long survey produces fatigue and falling response rates, and that corrupts the data you are trying to protect. What matters more than frequency is the gap between measuring and acting: if people answer a survey in March and see nothing change by September, response rates and candor both fall the following year. Measure at a cadence you can actually close the loop on, and tell people what changed before you ask them again.
What should you do when your engagement score drops?
Resist the urge to launch a company-wide initiative. First disaggregate: a drop in the overall average is almost always a small number of teams moving sharply, and only rarely everyone drifting together, so segment by team, tenure and manager before you interpret anything. Second, separate the driver from the symptom, because low scores on recognition or growth questions can mean a management problem or a mismatch between what people value and what their roles deliver, and those need opposite responses. Third, pick one change per team, name an owner, and report back within a quarter. One visible fix does more for the next cycle's score than five announced ones. The six-step playbook above covers the full sequence.
Is employee engagement the same as employee satisfaction or company culture?
No, and conflating them is why a lot of measurement produces nothing. Satisfaction asks whether someone is content, and a comfortable, unproductive employee can be exactly that. Engagement asks whether they are invested enough to put in discretionary effort. Culture is the shared set of norms and behaviors they operate inside. Culture belongs to the organization and engagement belongs to the individual. You can have satisfied but disengaged people, and a strong culture in one team alongside a weak one next door. They need separate instruments, which is why measuring organizational culture is a distinct exercise from measuring engagement.
How does Attuned measure employee engagement?
Attuned measures the inputs that produce engagement. Each person completes a roughly 10-minute assessment that maps them across 11 intrinsic motivators, and the platform then tracks how satisfied each of those drivers is over time. That produces a per-person, per-motivator read on the gap between what someone values and what their role currently delivers. That gap moves before turnover or absenteeism do. Because the reading is individual, a leader can see which specific person is drifting and on which specific driver, and the AI TalkCoach turns that into what to say in the next conversation.
Is Attuned GDPR-compliant?
Yes. Attuned operates under GDPR principles for any EU or UK data subject: lawful basis, data minimization, individual access rights, and the right to be forgotten. Users own their motivator data and choose what is shared with their organization. This landing page itself uses consent-gated cookies, so analytics and marketing scripts only load after you accept them. See our Privacy Policy for full details.
People Science for Managers

You already have the score.
The missing part is the name attached to it.

We measure what each individual is driven by and how satisfied those drivers currently are, so engagement becomes a reading you can act on, and stops being only a number you report.

We hold motivator data on more than 10,000 people across four generations, and we spend our days helping the managers above them read it. It costs your team about ten minutes each to find out what yours looks like.

No pitch deck
No callback queue
Real conversation
Proven with Azon Recruitment Group
A fast-growing firm that replaced instinct with a measurement, lifted retention, and saw it translate to earnings.
Book a Call Directly
Pick a time that works for you. No waiting for a callback. No sales queue.
Book a Time → Read the State of Motivation Report Or get the Psychological Safety Workbook
Book a time that works for you. No callback queue.
Past the average. See which person is drifting, and on which driver.
Book a Call →