People Science · For Leaders Who Want Culture in Numbers

How to Measure Organizational Culture

To measure organizational culture, combine quantitative and qualitative signals and track them over time: engagement and pulse surveys, eNPS, psychological safety and belonging scores, turnover and retention metrics, exit and stay interviews, and validated instruments like the OCAI.

The most precise method is to measure the distribution of the 11 intrinsic motivators across your team. This guide walks through all ten methods, then shows how Attuned turns culture from a feeling into data.

See the 10 Methods ↓ Book a Call Directly →
Trusted by
Azon Recruitment Group
Growing Firms & Startups
Teams Across 4+ Generations
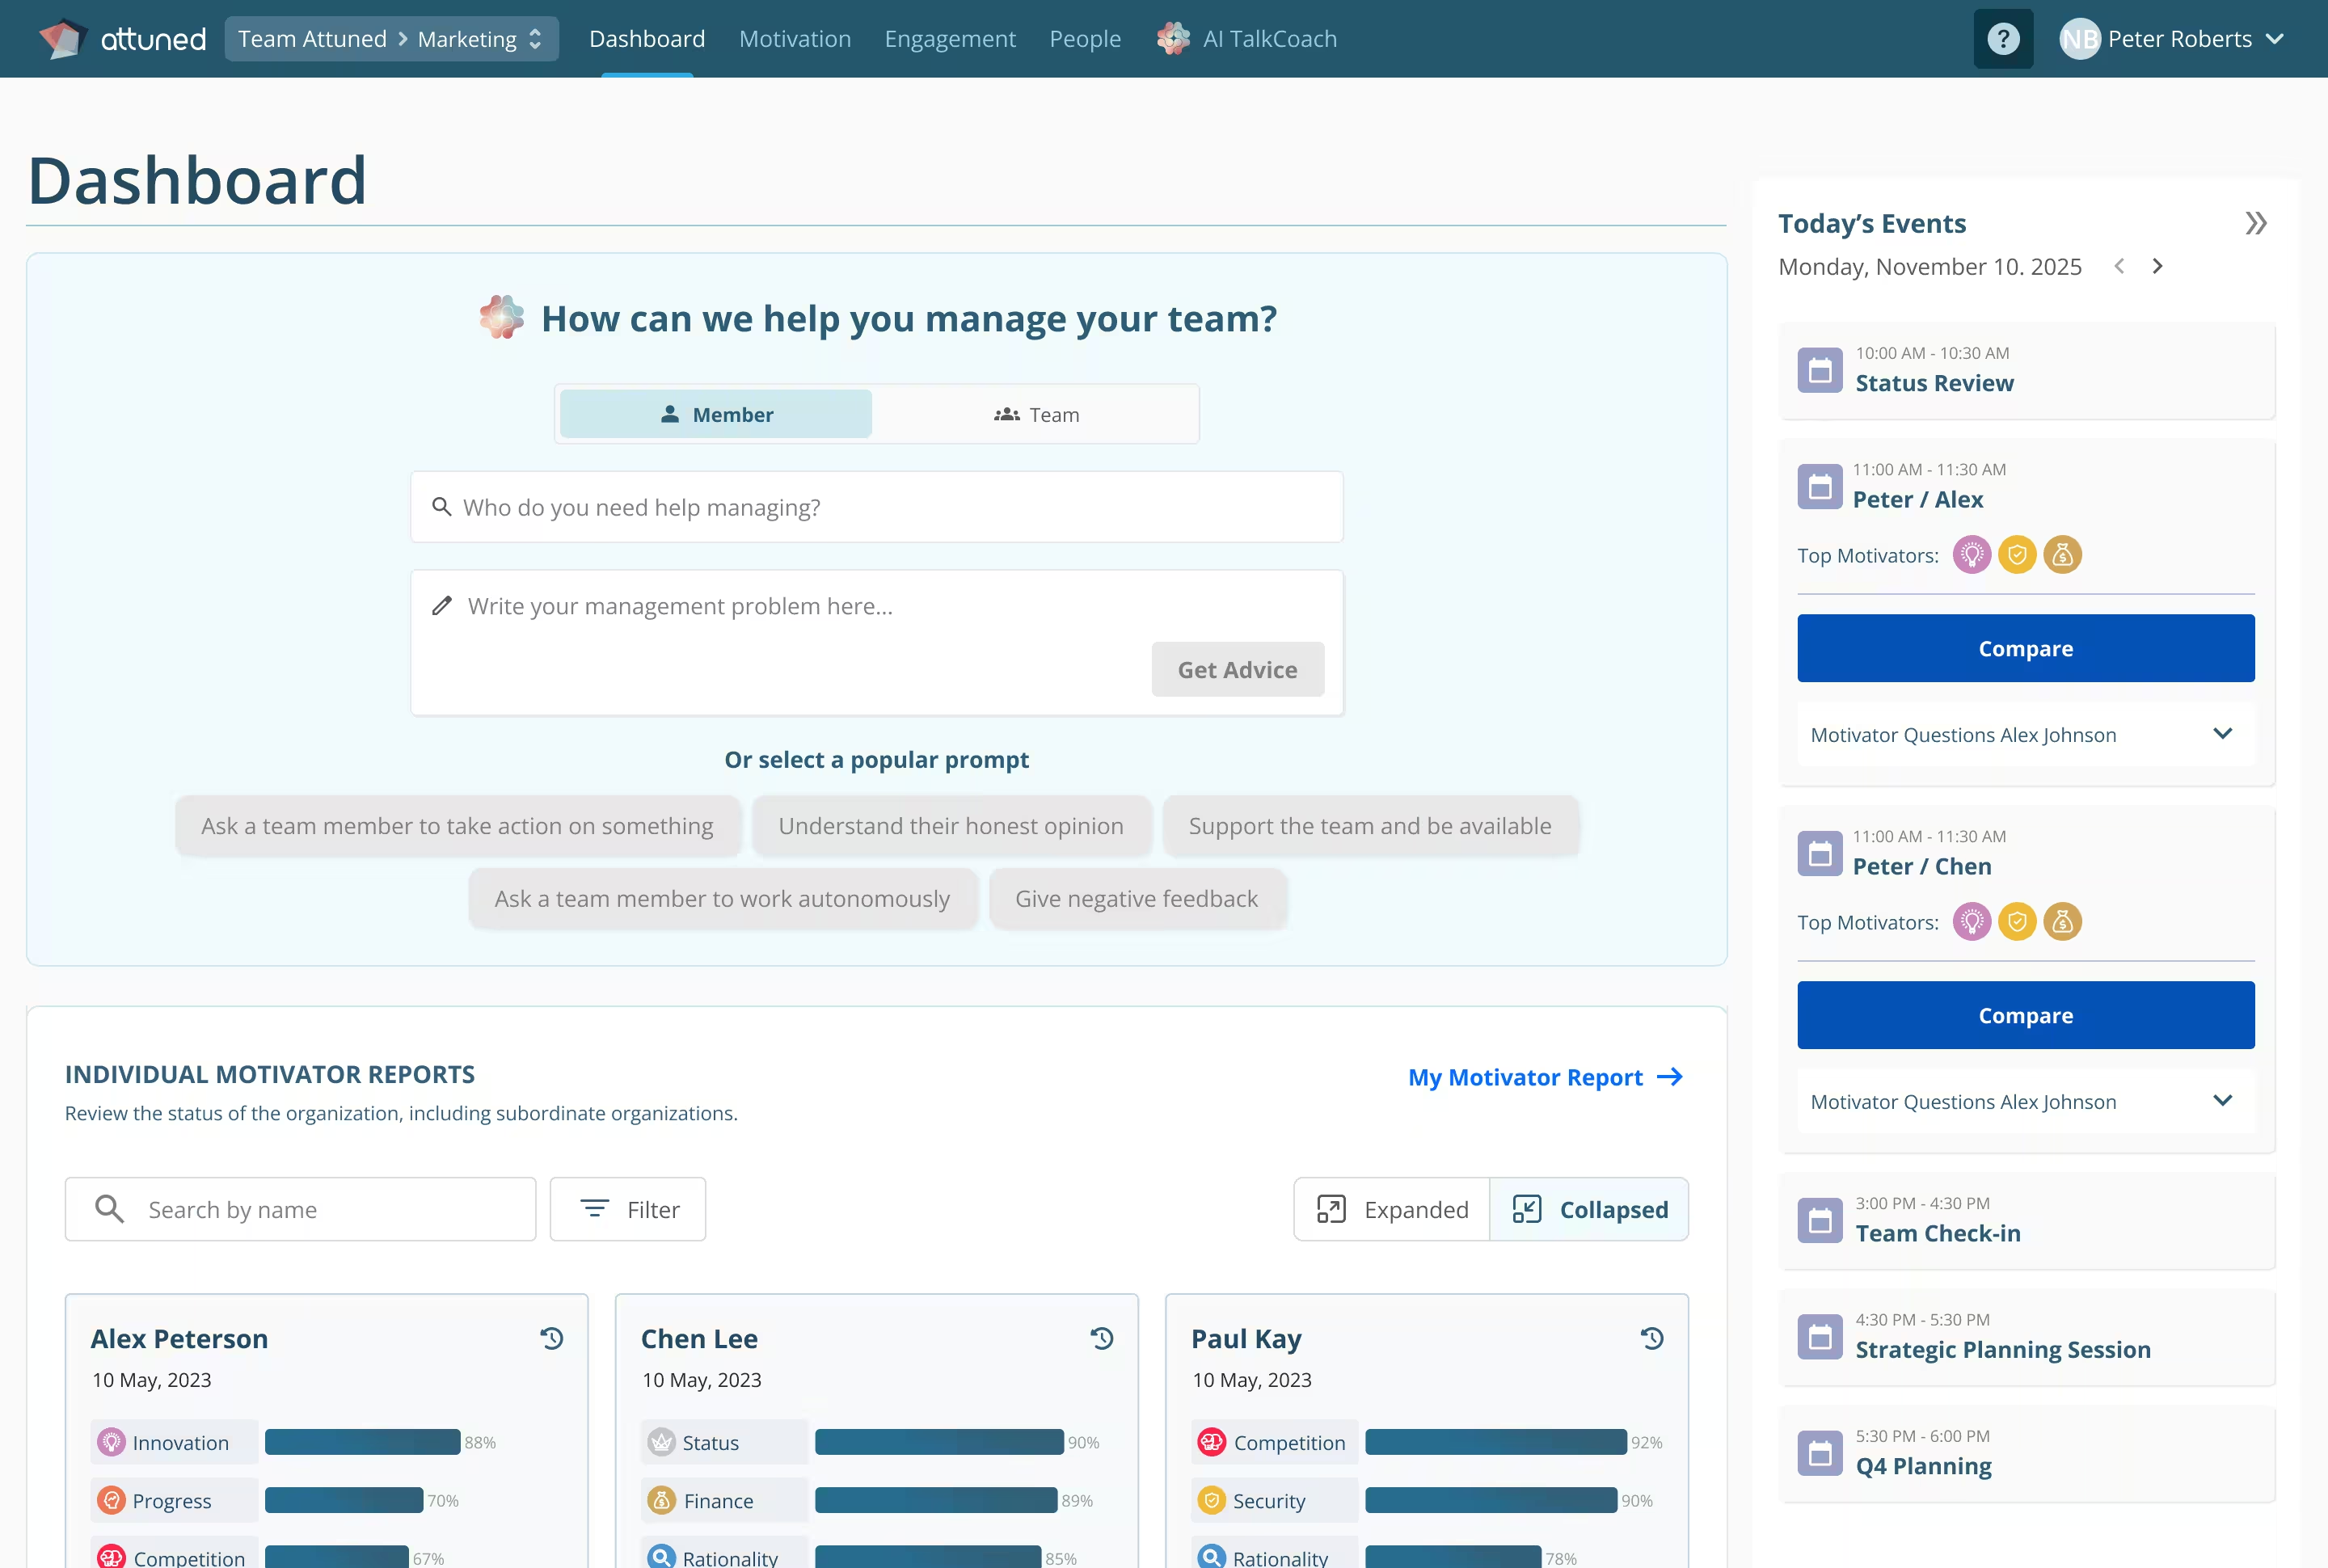
attuned.ai · Team Culture & Motivator Distribution
Attuned dashboard measuring organizational culture as the distribution of 11 intrinsic motivators across a team

Case Study · Azon Recruitment Group · Ireland

"Being able to get to the nub of people's underlying motivations has been very helpful."

Kevin Halligan, Associate Director, Azon Recruitment Group · on making culture measurable

A fast-growing firm whose culture was an instinct

Azon grew from a handful of people into an award-winning talent business. Leaders felt the culture was strong, but "felt" was the only measure they had, and instinct scales badly past the point where you can read the room.

Culture you could not see until it left

"If an employee was engaged and looked happy, the assumption was they were fine, until you got the resignation," their HR team noted. A culture measured only by mood gives you everyone's safest reading, right up to the exit interview.

Measured what actually drives each member

Attuned mapped every member across 11 intrinsic motivators, turning the team's culture into a distribution leaders could see: what the group valued, where individuals diverged, and which motivators were quietly going unmet.

Culture in numbers. Retention followed.

"A dramatic increase in the numbers of people we hire that we feel we've gotten right," reports Kevin Halligan, Associate Director. "We have really seen that benefit translating to earnings for our business."

From a hunch to a metric: Azon's leaders can now see what their culture is made of, and catch a motivator going unmet before it becomes a resignation letter. Read the full story →

Culture You Cannot Measure Is Culture You Cannot Manage

Organizational culture drives retention, engagement, and performance, yet most organizations still measure it once a year, if at all. Here is what the research says about the cost of leaving it unmeasured.

52%
Of voluntary departures are preventable, and managers could have caught most of them, if they had a way to see the drift in culture before the resignation.
Gallup
70%
Of the variance in team engagement traces back to the manager. Culture is measured team by team, because that is where it is actually lived.
Gallup, State of the American Manager
10,000+
Motivator assessments across more than four generations sit behind Attuned's model, so a culture reading is benchmarked, not improvised.
Attuned research base
1.7M
Possible combinations of the 11 intrinsic motivators. A culture is the specific pattern your people fall into, which is exactly what makes it measurable.
Attuned motivator model

Sound familiar?

Most organizations do not lack opinions about their culture. They lack a number they trust. Here is how it usually goes sideways, from two very different chairs.

The CEO Who Wants Culture on the Dashboard

"I can tell you our revenue to the dollar and our churn to the decimal. Ask me to measure our culture and I have a vibe."

You run the rest of the business on data. Culture is the one line item that comes back as a slide of adjectives and a survey score nobody quite believes. When the board asks whether culture is improving, you want a trend line, and all you have is the last all-hands.

  • A once-a-year engagement score with no idea what moves it
  • Culture described in adjectives, never in numbers you can track
  • No way to compare one team's culture with another's
  • Attrition you only understand after the person has gone
  • A gut sense the culture is drifting, and nothing to point at
"We spent a quarter defining our values and put them on the wall. A year later I could not tell you whether a single one of them had gotten stronger or weaker."

The People Leader Running the Annual Survey

"The survey goes out, the report comes back, we present it, and by the time we act the mood has already moved on."

You own the culture survey, and you know its limits better than anyone. Response rates sag, the results are three months stale on arrival, and the score tells you something is off without telling you what to change. You are measuring a moving thing with a photograph.

  • An annual survey that is out of date the week it lands
  • An eNPS that dropped, with no explanation attached
  • Survey fatigue eating your response rates
  • Plenty of sentiment data, nothing that says what people actually value
  • Results that produce a report, not a change
"Our engagement score went down four points and the whole leadership team spent a meeting guessing why. We were reading tea leaves with a confidence interval."

10 Ways to Measure Organizational Culture

No single number captures a culture, so the reliable approach is to triangulate: pair a few validated, quantitative measures with qualitative depth, and track the whole set over time. Here are the ten methods that matter, what each one is good for, and where each one falls short. The last one is where Attuned turns the whole exercise into data.

  1. Engagement & pulse surveys
  2. eNPS (employee Net Promoter Score)
  3. Psychological safety & belonging scores
  4. Turnover, retention & internal-promotion rates
  5. Exit & stay interviews
  6. Focus groups & one-on-ones
  7. Validated instruments (OCAI, Denison)
  8. Values-to-behavior alignment
  9. Absenteeism & operational signals
  10. External signals (Glassdoor, reviews)

1. Engagement & pulse surveys

Quantitative · recurring

The workhorse of culture measurement. A deeper baseline survey once or twice a year, plus short monthly or quarterly pulse checks, tracks how members experience the work. Good for trends and benchmarks; weak when it runs annually, since the culture has already moved by the time the report lands.

2. eNPS

Quantitative · headline metric

Employee Net Promoter Score asks how likely members are to recommend the organization as a place to work, on a -100 to +100 scale. It's a clean number you can track. The catch: it tells you something's off, not what, so it works best next to a measure of what people value.

3. Psychological safety & belonging

Quantitative · leading indicator

Amy Edmondson's psychological safety scale and belonging indices measure whether members can speak up, disagree, and admit mistakes without fear. These are strong leading indicators: they move before turnover does. Measure them per team, because safety is built or broken locally, one manager at a time.

4. Turnover, retention & promotion

Behavioral · lagging indicator

Voluntary turnover, regretted attrition, retention by tenure, and internal-promotion rates are culture made visible in behavior. Gallup finds 52% of voluntary departures are preventable, so these numbers are a scorecard on whether the culture holds people. They lag, though: by the time turnover spikes, the cause is months old.

5. Exit & stay interviews

Qualitative · depth

Exit interviews explain why people leave; stay interviews, the more underused of the pair, ask your best people why they stay while you can still act on the answer. Both add the texture a score cannot. The risk is bias: departing members soften the truth, so read them as themes, not verdicts.

6. Focus groups & one-on-ones

Qualitative · context

Small-group sessions and regular one-on-one meetings surface the stories behind the numbers: the norm nobody wrote down, the process everyone quietly routes around. They are how you turn a survey dip into a specific, fixable thing. They scale poorly and need real psychological safety to produce honest input.

7. Validated instruments (OCAI, Denison)

Quantitative · academic framework

The Organizational Culture Assessment Instrument (OCAI), built on the Competing Values Framework, classifies culture across Clan, Adhocracy, Market, and Hierarchy types. The Denison model links culture traits to performance. These give you a benchmarkable, research-backed profile. They map the type of culture well, but say less about the individual drivers underneath it.

8. Values-to-behavior alignment

Mixed · observation

Culture is what people do, not what is on the wall. Measure the gap between stated values and observed behavior: who gets promoted, what gets rewarded, which decisions get made under pressure. When "we value candor" coexists with meetings where no one disagrees, the alignment gap is your real culture reading.

9. Absenteeism & operational signals

Behavioral · no survey needed

Absenteeism, sick-day patterns, meeting load, after-hours activity, and collaboration data measure culture without adding another survey. A rising absence rate in one team is culture speaking through the timesheet. These signals are objective and always-on, but they are symptoms, so they need a diagnostic layer to explain the cause.

10. External signals (Glassdoor, reviews)

External · reputation

Glassdoor ratings, Indeed reviews, and candidate feedback show how your culture reads from outside, which shapes hiring and brand. They are unfiltered and public. Treat them as directional: reviews skew toward the very happy and the very burned, so watch the trend and the themes rather than the star count alone.

The method most teams are missing

Every method above measures how people feel or how they behave. None of them measures what a team actually values, which is the raw material culture is made from. That is the eleventh method, and the spine of this page: mapping the distribution of the 11 intrinsic motivators across your team. It is covered in full in the next section, and it is the part Attuned was built to do.
The Science Under a Culture That Holds People

Culture is the sum of what a group of people are driven by, and intrinsic motivation is the engine underneath it. This 5-minute video explains the difference between intrinsic and extrinsic motivation, and why measuring the intrinsic side is what makes a culture reading predictive rather than just descriptive.

Attuned · YouTube
Intrinsic vs. Extrinsic Motivation, and Why It Is What Your Culture Is Made Of
Click to play, loads YouTube only after you click

Most tools measure how a team feels.
Attuned measures what a team is made of.

Sentiment surveys give you a mood for the quarter. That is worth having, but a mood is a symptom. Attuned measures organizational culture at the layer underneath: the distribution of the 11 intrinsic motivators across your team. Culture, measured this way, stops being an adjective and becomes a shape you can read, compare, and track.

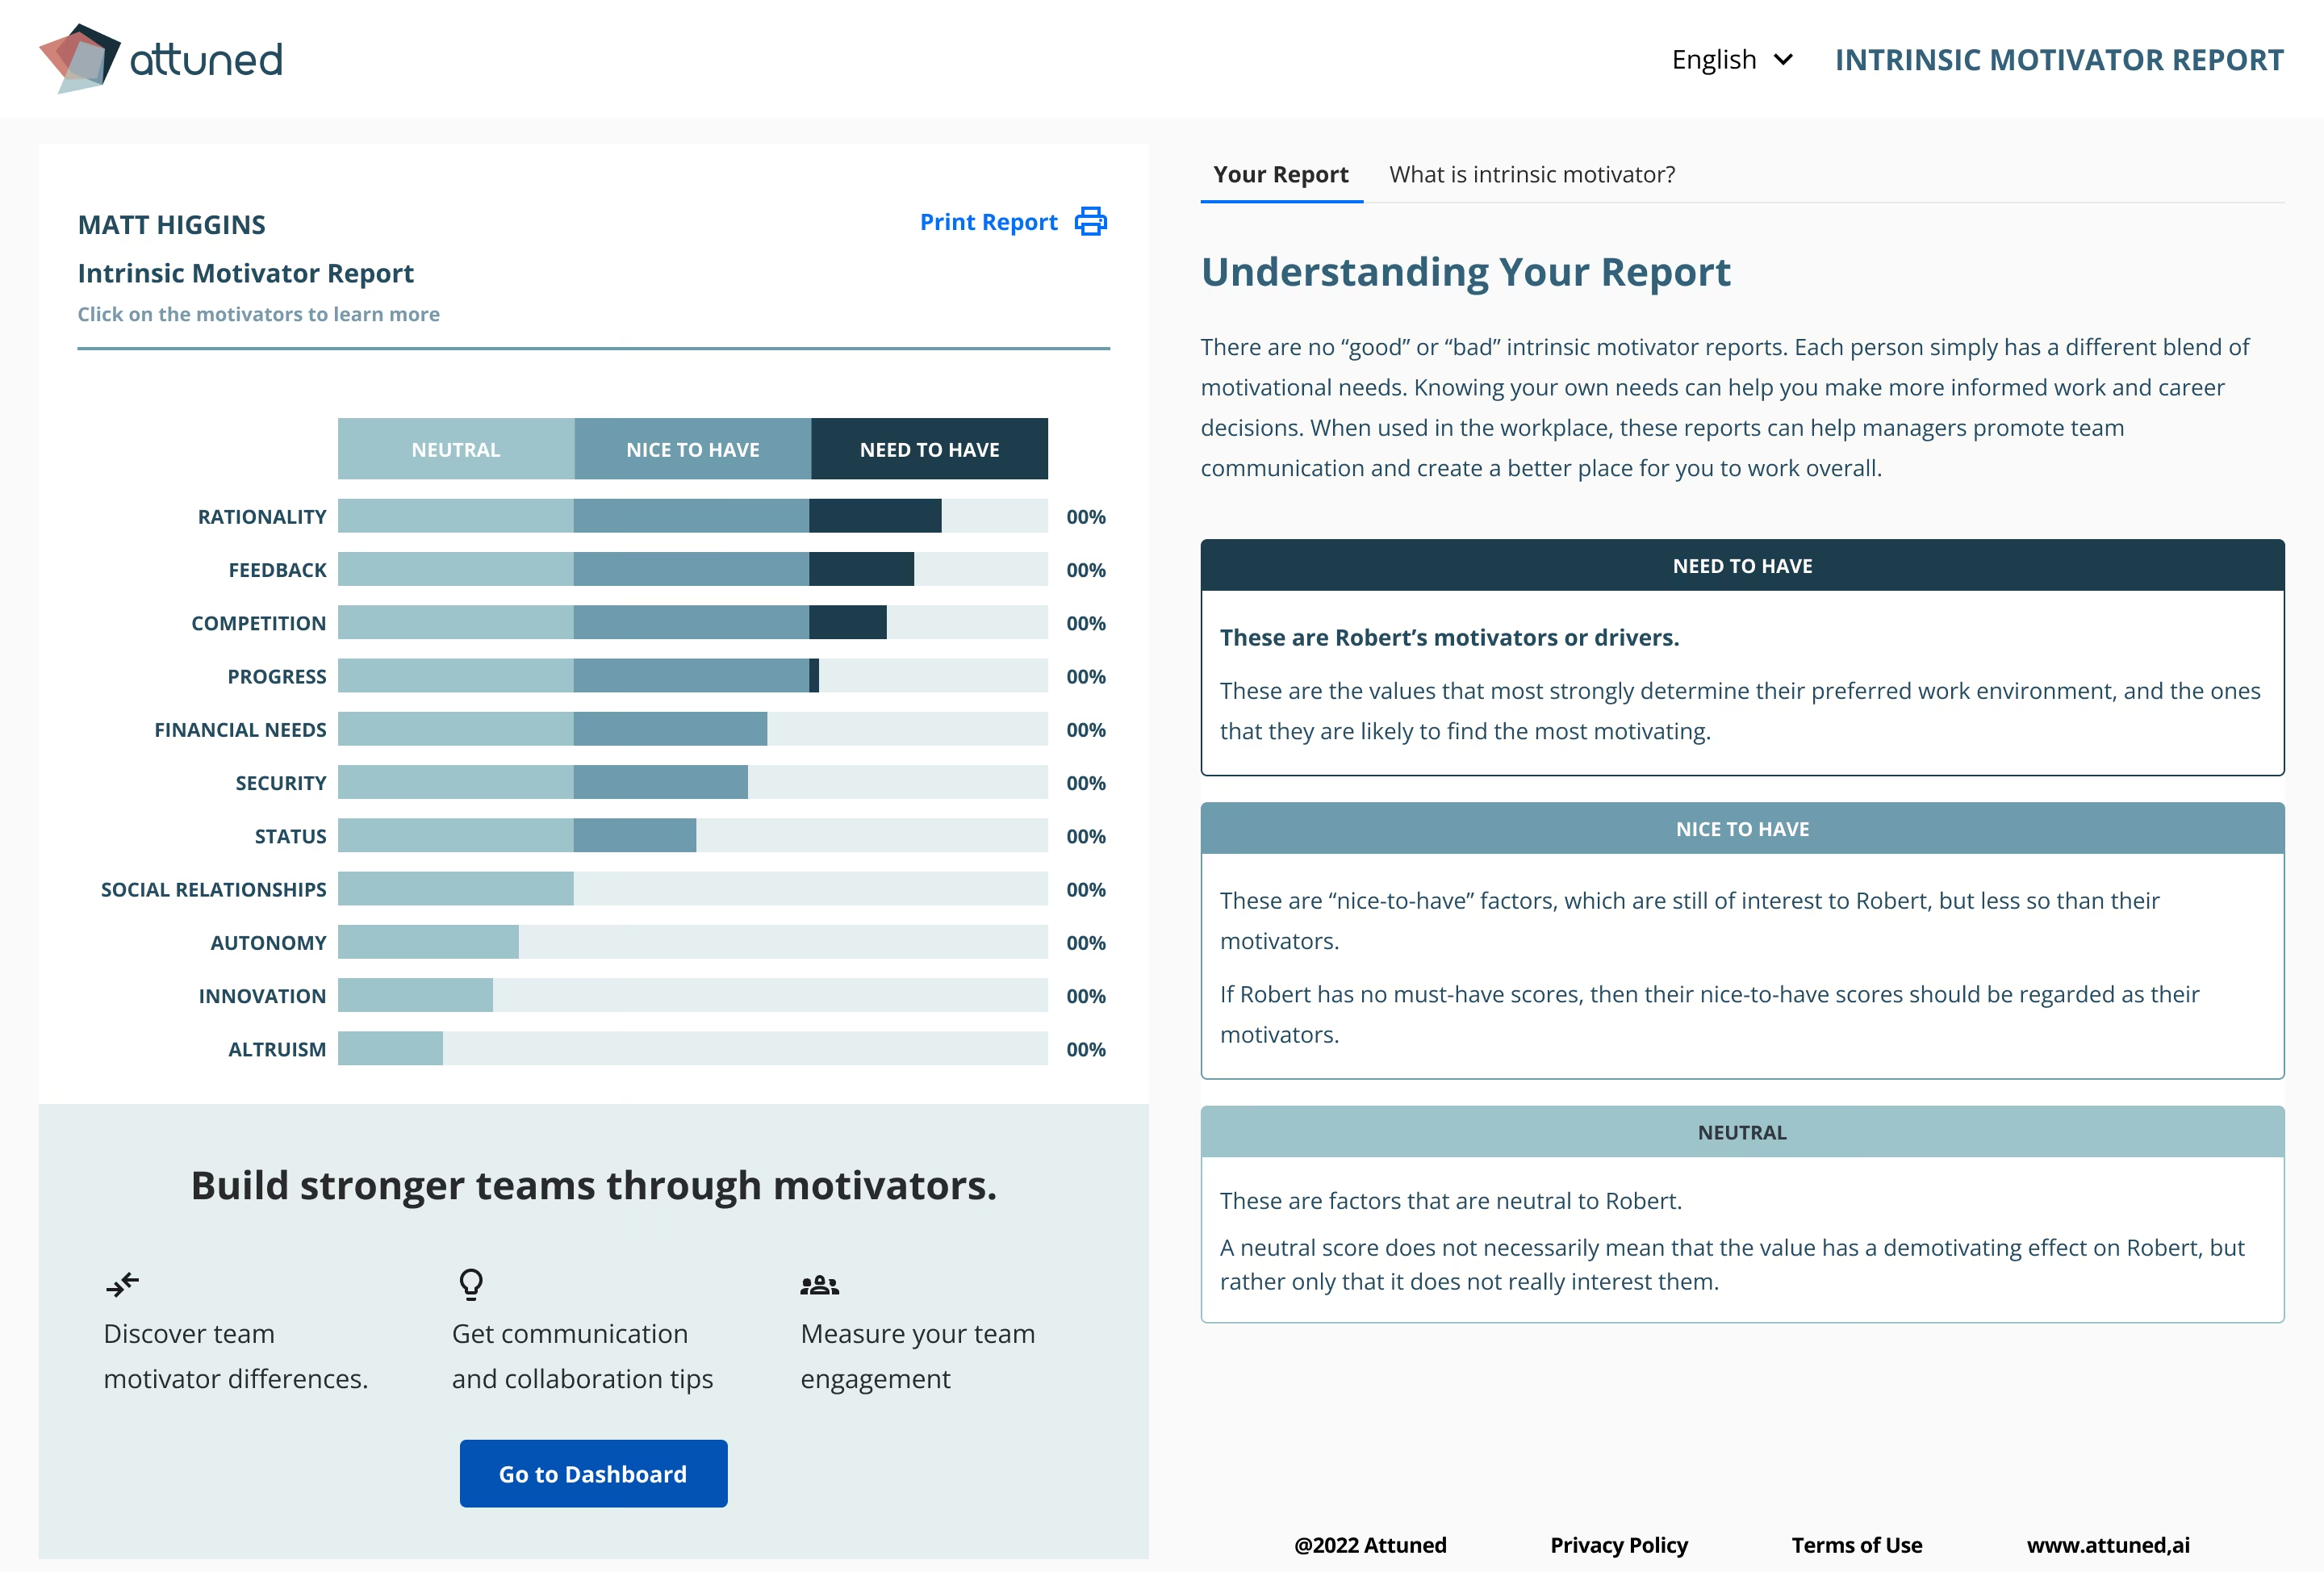
The Team Culture view: how the distribution of motivators reveals what a group actually values
Attuned Team Culture view showing the distribution of the 11 intrinsic motivators across a team as a quantitative culture metric
11
intrinsic motivators, mapped per member, with over 1.7 million possible combinations. Your culture is the specific pattern your people fall into. Attuned motivator model
Research Insight

Psychologist Adam Mastroianni has written that "How are you?" is a ritual question that expects a ritual answer. Both parties understand: what is being exchanged is a performance of connection, not connection itself. An annual engagement survey often works the same way. People tick the boxes, the average looks fine, and the actual shape of what the team values never shows up in the number.

Adam Mastroianni, Experimental History

Culture as a distribution, not an average

An engagement score flattens a team into one number, and averages hide the interesting part. Two teams can post the same score while one is a room full of members driven by Autonomy and Innovation and the other by Security and Social Relationships. Those are two different cultures, and they need managing in two different ways. Attuned shows the distribution, so you see the culture, not just its midpoint.

It also quantifies the gap between each individual and the team, and surfaces the blindspots where a leader's assumptions and the group's real drivers diverge. That pairs naturally with our intrinsic motivation assessment and 1-on-1 coaching software, so measuring the culture and acting on it live in the same place.

  • See the distribution of all 11 motivators across a team, in numbers
  • Quantify the gap between each member and the group they sit in
  • Surface blindspots where leadership and the team diverge
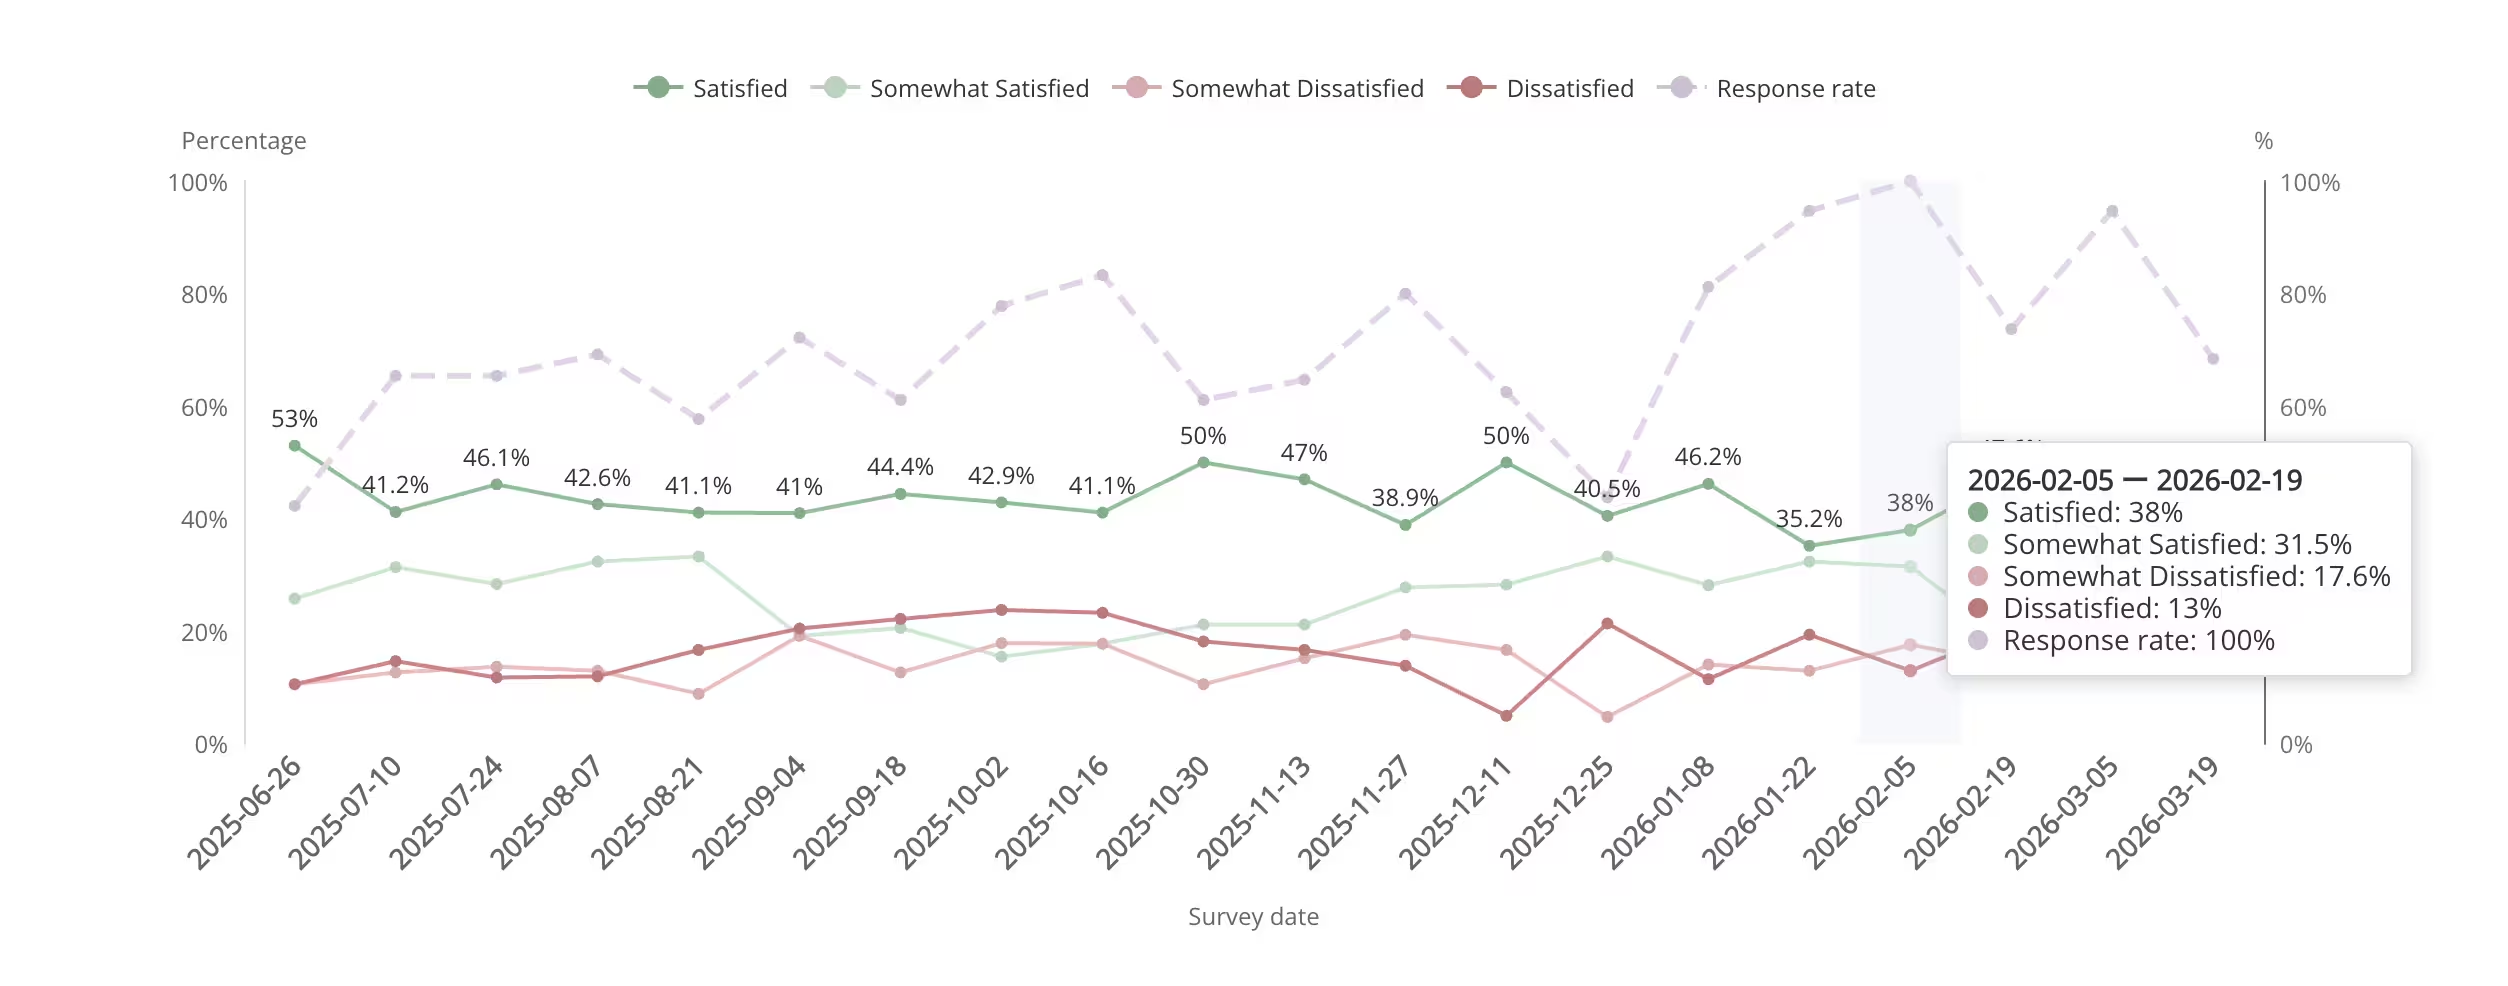
  • Track motivator satisfaction over time and catch drift early

A doctor who measured only the average temperature of a hospital ward would report that everyone is fine, while one member burns at 40 degrees and another shivers at 35. An engagement average does the same to a team. The distribution is where the patients actually are.

Motivator satisfaction over time, how Attuned turns culture into a trend line you can watch
Motivator satisfaction trend dashboard showing how Attuned tracks organizational culture continuously over time

4 Reasons Your Culture Metrics Miss What Matters

Most organizations do measure culture. The trouble is how. These are the four traps that turn a measurement program into a report nobody acts on, and each one is fixable.

01

Measuring once a year

An annual survey is a photograph of a moving thing. By the time you read the results, the moment has passed and the team has changed. Culture that is measured yearly can only ever be managed in hindsight.

02

Trusting the average

One number for the whole company hides where culture actually lives. A healthy average can sit on top of one team quietly falling apart. Culture is a distribution, and the parts you most need to see are the ones an average erases.

03

Measuring mood, not drivers

Sentiment tells you a team is happy or not this quarter. It does not tell you what they value, so it cannot tell you what to change. A satisfaction score without a driver behind it is a thermometer with no diagnosis.

04

A report, not an action

The most common failure is measuring culture and then filing it. If the number does not sit next to a specific, ownable next step, the survey trained your people to expect nothing to change, which is worse than not asking.

How to Build a Culture Measurement Program

Picking metrics is the easy part. Turning them into something that actually moves the culture takes a bit of design. Here are seven steps that separate a measurement program leaders act on from a survey that gathers dust.

A sentiment survey alone vs. measuring the motivator distribution
What you measure Annual sentiment survey Culture as data, with Attuned
What it captures How people feel this quarter What the team actually values, member by member
The shape of the answer A single average score A distribution across 11 motivators, per team
Cadence Once or twice a year Continuous, with drift tracked over time
What you do with it Guess at what moved the number See the specific unmet driver and act on it
Grounded in This year's question wording Validated science: 11 motivators, 1.7M combinations, 10,000+ assessments

1. Define what you mean by culture

Before you measure, name the thing. Are you tracking values, norms, engagement, or what drives people? A metric only means something against a definition. Write down the two or three outcomes culture is supposed to produce for you, then choose metrics that map to them.

2. Triangulate, never rely on one metric

Pair a quantitative measure (eNPS, motivator distribution), a leading indicator (psychological safety), and a behavioral one (turnover, absenteeism). Any single number lies by omission. Three that agree are a signal; three that disagree are the most interesting thing on the dashboard.

3. Measure continuously, not annually

Replace the once-a-year event with a light, always-on rhythm: a baseline plus pulse checks and a continuous driver signal. You're measuring a moving thing, so measure it often enough to see it move while you can still respond.

4. Read the distribution, not the average

Always break culture metrics down by team, tenure, and role. The company average is where problems go to hide. This is exactly what Attuned's intrinsic motivation assessment is built to show: the spread of what people value, not just the midpoint.

5. Protect honesty with safety

People answer a culture survey exactly as safe as they feel. Guarantee anonymity where you promise it, act visibly on what you hear, and never trace a hard answer back to a member. The first time honesty costs someone, your data quietly turns to noise.

6. Attach an owner to every metric

A number with no owner is a number with no future. Assign each culture metric to a leader who is accountable for moving it, and review it on the same cadence as revenue. Culture improves when it is managed like anything else the business takes seriously.

7. Close the loop out loud

Tell people what you measured, what it said, and what you changed because of it. When a measurement leads to a visible action, the next round of data gets more honest. When it needs a harder conversation, our guide to giving difficult feedback covers how to have it well.

A Ratio Worth Remembering: lead and lag together

The strongest culture programs pair lagging indicators with leading ones. Lagging metrics such as turnover and absenteeism tell you what already happened; leading metrics such as motivator satisfaction and psychological safety tell you what is about to. If you only track lagging metrics, you are steering by the rear-view mirror. Research on feedback offers a useful ratio to carry into the work too: teams where positive feedback outnumbers the negative by about five to one tend to perform best, so when you report culture data, weight the conversation toward what is working before you get to what is not.

Attuned Motivator research, feedback best practices

From a culture you can only describe to a culture you can measure, in under a week

Here is how an organization goes from a once-a-year survey score to a live, quantified picture of its culture, without a rollout project or a data team.

Step 0 · Start Here

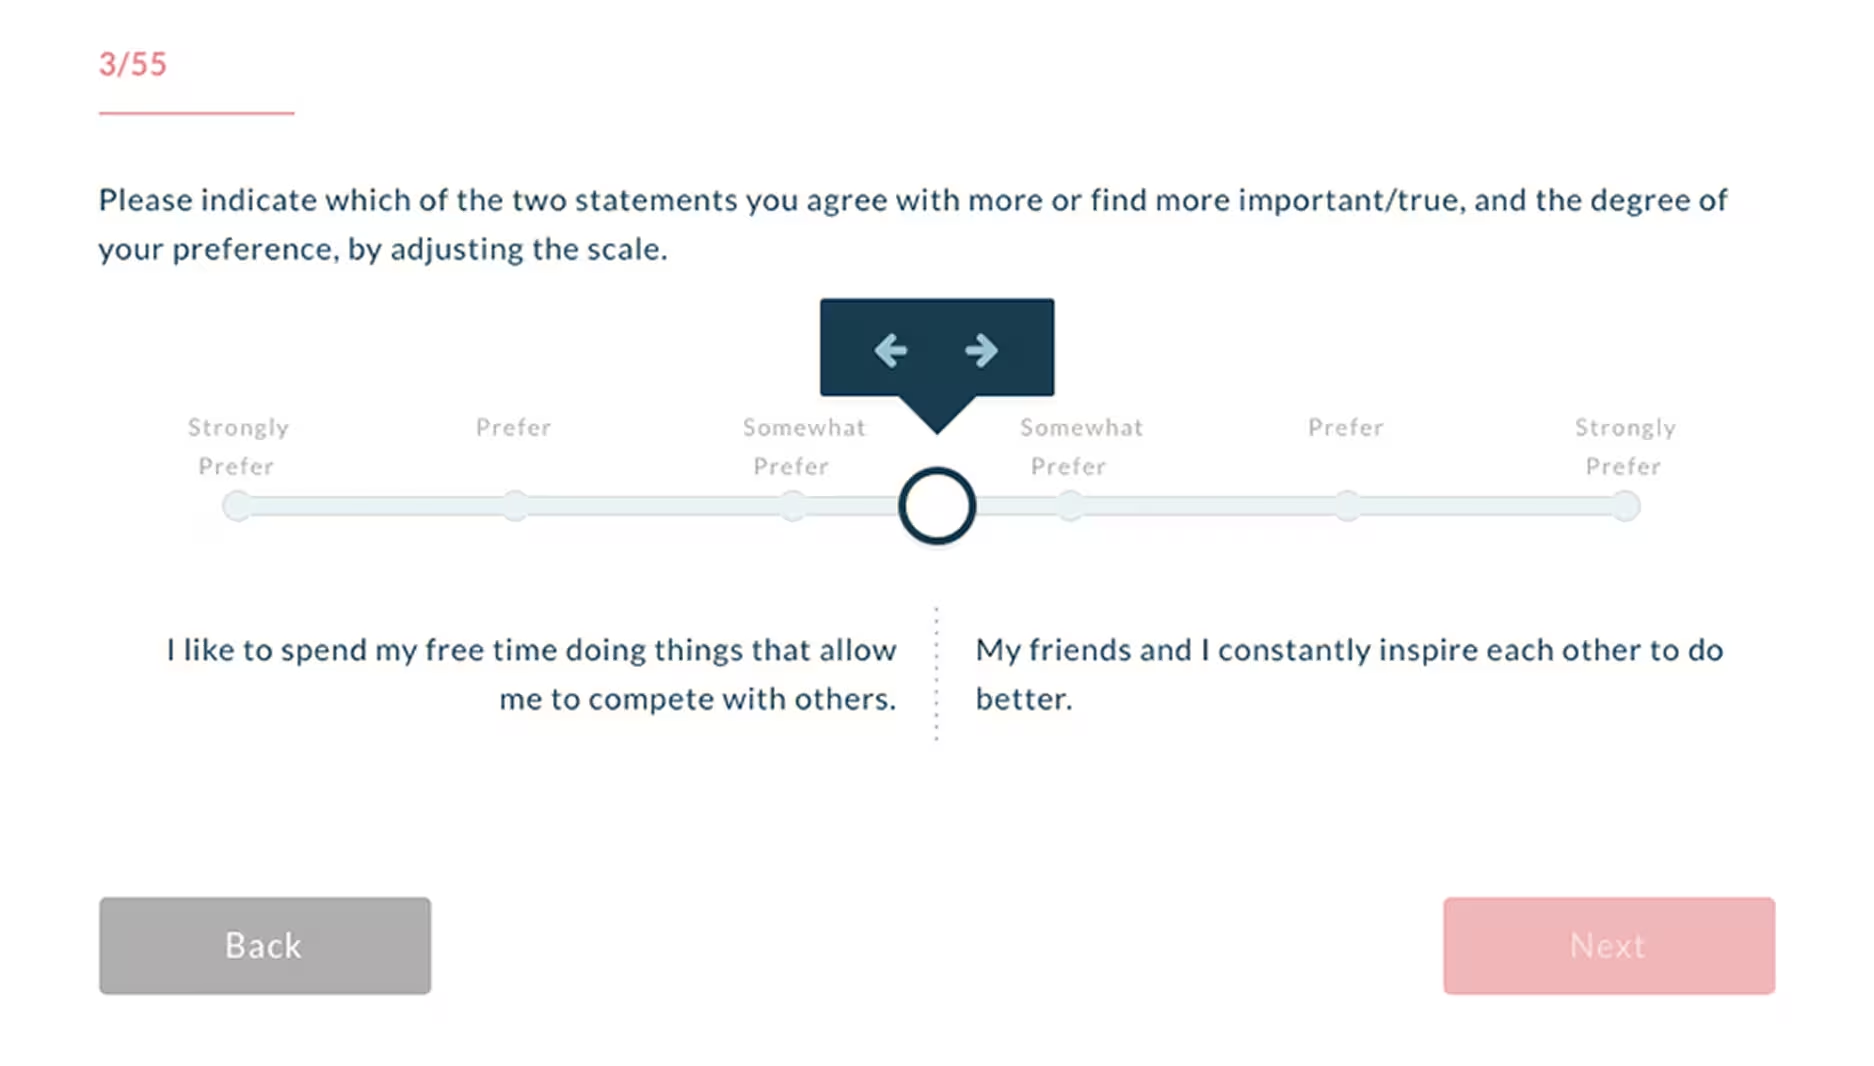
Every member completes a ~10-minute assessment. That's the whole setup.

No rollout plan. No IT project. Each member answers a simple set of questions, and Attuned automatically calculates their profile across 11 intrinsic motivators, then rolls the profiles up into a Team Culture view. Most organizations have their culture mapped within a week of signing up.

~10 minper member
11motivators mapped
1.7Mpossible profiles
Week 1culture mapped

Slider-based assessment, ~10 min per member

Attuned motivator assessment screen with slider-based questions used to measure what each member values

Team Culture distribution generated immediately

Attuned dashboard showing a team's culture as the distribution of intrinsic motivators across its members
01
Map the Baseline

Turn a hunch into a distribution

Every member gets a profile across 11 motivators, and Attuned rolls them into a Team Culture view. You see, in numbers, what your culture is made of: which motivators dominate, which are scarce, and how the shape differs from team to team.

11 motivator dimensions Team-level distribution
02
Quantify the Gaps

Measure the distance between people and the group

Attuned quantifies the gap between each member and their team, and surfaces the blindspots where leadership's assumptions and the group's real drivers diverge. A culture problem stops being a feeling and becomes a specific, named gap you can point at.

Individual-to-team gap Blindspot detection
03
Track the Trend

Watch culture move, month to month

Attuned tracks motivator satisfaction over time, so culture becomes a trend line rather than an annual snapshot. When a driver starts going unmet in a team, you see the line bend before it shows up in the exit interviews.

Continuous tracking Early drift alerts
04
Act on the Data

Turn the metric into a next step

The AI TalkCoach translates each profile and gap into what to do about it: how to lead a member, what to recognize, what to steer around. Culture data lands next to an action, and pairs with our approach to giving difficult feedback when a conversation needs to go deeper.

AI guidance per member Owned, specific actions
05
Keep Your People

Catch the overlooked before they leave

Because the signal is continuous, Attuned flags the gap between what a member values and what their role delivers before the symptoms reach the work. Gallup finds 52% of voluntary departures are preventable, and most of them start as a driver you could have addressed two months earlier.

Preventable-attrition signal Retention, before the exit
Ready to put a number on your culture?
See your culture as a distribution, not a once-a-year score, in under a week.
No IT project. Your teams are mapped and your culture is on a dashboard, in numbers you can track, before Friday.
Book a Call Directly →
Book a time that works for you · No callback queue

How a Growing Firm Made Its Culture Measurable

Azon Recruitment Group grew from a small team into an award-winning business by measuring what drives its people instead of guessing at the mood of the room. With culture turned into data, leaders could see what the team valued, act on the gaps, and watch retention and earnings follow.

Azon Recruitment Group team, a fast-growing firm that made its organizational culture measurable with Attuned

More on Measuring and Building Culture

Reading from the Attuned team, starting with the State of Motivation Report most leaders open first, plus practical pieces on psychological safety, feedback, management, and the drivers that make up a culture.

Anyone can measure the mood. Measuring what the culture is made of is the hard part.

Plenty of tools will give you an engagement score. What they cannot give you is the shape underneath it: what your people actually value, where teams diverge, and which driver is quietly going unmet. That is the part Attuned measures.

Culture mapped in a week

A ~10-minute assessment per member. No IT project, no data team required. Your whole organization can be mapped within days of signing up.

The whole spread, not one score

11 intrinsic motivators mapped per member and rolled into a Team Culture view, so you can see where the outliers actually sit, not just where the team lands on average.

Continuous, not annual

Motivator satisfaction tracked over time turns culture into a trend line, so you catch drift while you can still do something about it.

GDPR-compliant by design

Lawful basis, data minimization, individual access rights, and the right to be forgotten. Your people own their motivator data.

Measuring Organizational Culture: Common Questions

How do you measure organizational culture?
Measure organizational culture by combining quantitative and qualitative signals and tracking them over time rather than in a single annual survey. The core methods are: engagement and pulse surveys, eNPS, psychological safety and belonging scores, turnover and retention plus internal-promotion rates, exit and stay interviews, focus groups and one-on-ones, validated instruments such as the OCAI and the Denison model, values-to-behavior alignment, absenteeism, and external signals like Glassdoor reviews. The most precise approach is to measure culture as data: the distribution of the 11 intrinsic motivators across your team, which turns a vague idea into numbers you can compare and track.
What metrics measure company culture?
The most useful culture metrics are eNPS (employee Net Promoter Score), engagement and pulse-survey scores, psychological safety and belonging indices, voluntary turnover and regretted-attrition rates, retention and internal-promotion rates, absenteeism, participation and response rates on surveys, and the spread of intrinsic motivators across a team. No single number captures culture, so track a small set of leading indicators (motivator satisfaction, psychological safety, pulse scores) alongside lagging ones (turnover, absenteeism) and watch how they move together.
What is the best way to measure company culture quantitatively?
Quantitatively, culture is the pattern of what a group of people actually value. Attuned measures that directly: every member completes a roughly 10-minute assessment that maps them across 11 intrinsic motivators, and the platform then shows the distribution of those motivators across the team, the gap between each individual and the group, and how satisfaction on each motivator drifts over time. Sentiment surveys tell you how people feel this quarter; a motivator distribution tells you what the culture is made of, in numbers you can compare across teams and track month to month.
How often should you measure organizational culture?
Continuously, with a light touch, rather than once a year. An annual engagement survey is a photograph of a moving thing: by the time you read it, the moment has passed. Pair a deeper baseline once or twice a year with short monthly or quarterly pulse checks, and track leading indicators such as motivator satisfaction and psychological safety in between. The point of measuring more often is not more dashboards; it is catching a drift while you can still do something about it.
What is an organizational culture survey?
An organizational culture survey is a structured questionnaire that measures how members experience the norms, values, and working conditions of their organization. Some use validated academic frameworks, such as the Organizational Culture Assessment Instrument (OCAI), built on the Competing Values Framework, or the Denison model. Others are custom engagement or pulse surveys. A good culture survey pairs a few benchmarkable, validated questions with a way to act on the results, so it changes something rather than just producing a report.
How does Attuned measure organizational culture?
Attuned treats culture as measurable data. Each member maps across 11 intrinsic motivators through a roughly 10-minute assessment, drawing on a model with over 1.7 million possible motivator combinations and more than 10,000 assessments across four generations. Attuned then shows the Team Culture view: the distribution of motivators across the group, the blindspots where a manager's assumptions and the team's real drivers diverge, and the satisfaction trend on each motivator over time. That gives leaders a quantified picture of culture they can compare across teams and watch continuously, instead of a once-a-year sentiment score.
What is a good eNPS score?
eNPS runs from -100 to +100 and asks how likely members are to recommend the organization as a place to work. As a rough guide, anything above zero means promoters outnumber detractors, a score in the 10 to 30 range is commonly considered good, and above 30 to 40 is strong. Benchmarks vary widely by industry and region, so the trend in your own eNPS over time matters more than any single external number. eNPS is a useful headline metric, but it tells you that something is off, not what, which is why it works best next to a measure of what people actually value.
Can you measure culture without annual surveys?
Yes, and increasingly leaders do. Behavioral and operational data measure culture without adding another survey: voluntary turnover, regretted attrition, internal-promotion rates, absenteeism, meeting and collaboration patterns, and participation rates. Stay interviews and focus groups add qualitative depth. Attuned adds a continuous quantitative layer by tracking motivator satisfaction over time, so the culture signal keeps coming in between any formal surveys rather than going dark for eleven months of the year.
People Science for Leaders

A survey score is a start.
Seeing what your culture is made of is the edge.

We have spent years studying what drives people at work, and helping leaders turn culture from an adjective on the wall into a number they can track. It fits into how you already run the business rather than adding a project to it.

Our expertise is people science: what drives individuals, how a team's motivators combine into a culture, and where that culture is quietly drifting. We have brought it to fast-growing firms like Azon, and we would like to bring it to yours.

No pitch deck
No callback queue
Real conversation
Proven with Azon Recruitment Group
A fast-growing firm that made its culture measurable, lifted retention, and saw it translate to earnings.
Book a Call Directly
Pick a time that works for you. No waiting for a callback. No sales queue.
Book a Time → Read the State of Motivation Report Or read the full Azon case study →
Book a time that works for you. No callback queue.
Put a number on your culture. See your culture as a live distribution, not a yearly score.
Book a Call →