Employee Flight Risk, and Why the Warning Signs Arrive Late
Updated September 2026 · by Casey Wahl, Founder, Attuned
Every guide to employee flight risk hands you the same list of behaviors to watch for: output drops, the calendar thins, someone stops volunteering. Those are real. They're also the last thing to change, which is why the list so often gets read in hindsight. Below are the 12 signs, what each one gets wrong, the condition data that moves earlier, and a scoring matrix you can copy and run this week.
motivator data on 10,000+ people across four generations
The last three months before a voluntary resignation
Gallup, Q4 2023 · n=717 US voluntary leavers
Swipe to see the full chart →
Three months is close to the whole observable window, and for 45% of leavers nobody used it. A watch list built on behavior is competing with a countdown that has already started.
How little runway the behavioral signs actually get How often the one conversation that would have surfaced it never happened
Definition
What Is Employee Flight Risk?
Employee flight risk is the likelihood that a specific person will voluntarily leave the organization within a defined window, usually the next six to twelve months. It's a forecast about one named individual, which is what separates it from turnover, a rate measured after the fact across a population.
Flight Risk
A forward-looking judgment about one person: how likely they are to resign, and roughly when. It's only useful if it arrives early enough to act on, and only defensible if you can say what it's based on.
Retention Risk
The same forecast weighted by what losing the person would cost. A tenured specialist with no successor and a six-month ramp is a higher retention risk than a colleague at identical flight risk, because the exposure is larger.
Attrition Rate
A population-level number, measured after people have gone. It's the score at full time. Useful for budgeting and for spotting a trend, and no help at all in deciding what to do about Priya on Thursday.
Regretted Attrition
The share of departures the organization would have paid to prevent. This is the number a flight risk program is really trying to move, and the one most dashboards do not separate out.
Those four get used interchangeably in most conversations about employee flight risk, and the substitution matters. If you report attrition and call it flight risk, you have described the past and named it a forecast. For the population-level view and how to instrument it, see our guide to turnover metrics every CEO should track.
The Numbers
Most of the Damage Is Preventable, and Most of the Window Goes Unused
The figure still doing most of the work on this topic, including on two of the pages currently ranking for it, is Ceridian's 2022 Pulse of Talent finding that 61% of employees were a flight risk. Gallup has since run the question on people who actually left, and those answers are more useful, because they say what would have worked.
42%
of employees who voluntarily left in the past year say their manager or organization could have done something to prevent it. The single largest category they named was compensation and benefits, at 30%, followed by positive manager interactions at 21%.
of voluntary leavers report that in the three months before they left, neither a manager nor any other leader proactively discussed their job satisfaction, performance or future with them.
of voluntary leavers either left within three months of starting to search, or did not actively search at all. The stretch during which a behavioral watch list could plausibly catch someone is short, and for many people it never opens.
US workers quit their jobs in July 2026, a quits rate of 1.9%. Quits are the closest thing to a national flight risk reading, and they are counted only once the decision has been executed.
Underneath those sits the condition that produces them. 20% of employees worldwide were engaged in 2025, the lowest Gallup has recorded since 2020 and the second consecutive annual decline, at an estimated cost to the world economy of around $10 trillion in lost productivity, roughly 9% of global GDP, on Gallup's figures. A flight risk program that starts at the individual behavior is working several steps downstream of that.
Who This Is For
Sound Familiar?
The HR Director With a Flight Risk Dashboard
Has the scores, and cannot get a manager to act on one
The model reads tenure, time since last promotion, compensation ratio and the last engagement score. Every one of those is a fact about the job record rather than about the person in it.
It flags the same forty people every quarter, most of whom are still here, so managers have quietly stopped opening it.
When it does fire correctly, the alert says who. It has never once said what to do about it.
"I can rank my whole population by flight risk. I cannot tell one manager what conversation to have."
The Manager Who Got the Resignation on a Tuesday
Had a good one-on-one with this person eight days earlier
Nothing in their behavior had changed. The work was good, the meetings were attended, the mood was normal.
At the exit interview they described something that had been true for about seven months, and said it had never quite come up.
Now you're re-reading the signs list and finding that this person showed none of them.
"There was no drop-off. That is the part I keep going back to. There was nothing to notice."
The Question Under the Signs
Why Do Employees Become a Flight Risk?
People become a flight risk when something they need from work stops arriving and nobody notices in time. Gallup asked the people who had already gone what would have kept them, and the answers sort into five buckets: compensation and benefits (30%), better interactions with their manager (21%), organizational issues (13%), career advancement (11%) and staffing or workload (9%). What that list does not say is which bucket applies to the person in front of you, and those five are not equally weighted for any two people.
Pay Stopped Being Defensible
The largest single bucket at 30%, and the one every organization reaches for first. It matters most to the people who score high on Financial Needs and Security, and it is close to inert for someone whose two top drivers are Autonomy and Innovation. Offered to the wrong person it buys a few months.
The Manager Relationship Went Quiet
21% named better interactions with their manager. This is the bucket that maps onto Feedback and Social Relationships, and it is also the cheapest to fix, which is what makes 45% having had no proactive conversation at all such an expensive statistic.
The Path Forward Disappeared
11% named career advancement. For someone high on Progress or Status, a promotion cycle that slips twice reads as a closed door, and they will usually stop asking before they start looking. The absence of the question is the signal.
The Work Itself Changed Shape
Organizational issues at 13% and staffing or workload at 9%. A reorg that takes away decision rights hits Autonomy. A pivot that replaces the interesting problem with maintenance hits Innovation. A team that doubles in size hits Social Relationships. The job title did not change, so nothing was flagged.
Read the four together and the pattern is the same each time: a specific person had a specific need, the job stopped supplying it, and the organization was measuring something else. Attuned names those needs as 11 intrinsic motivators, scored per person, which is what turns "career advancement" from a survey category into a sentence about Priya.
The Watch List
The 12 Signs of a Flight Risk Employee, and When Each One Reads Wrong
This is the list the ranking articles on employee flight risk publish, and it's worth having. What is usually missing is the second half of each entry: the condition under which the same behavior means something else entirely. A sign you can't falsify is a sign that'll generate false positives until people stop trusting it.
1
Output Narrows to the Job Description
The work still lands on time and to standard. What stops is everything outside the boundary: the extra pass, the unprompted fix, the thing nobody asked for.
Reads wrong when the person has just been told, correctly, to stop overextending. Scope discipline and disengagement look identical from outside.
2
Withdrawal From Optional Work
Hiring panels, the mentoring program, the internal guild, the offsite planning group. The commitments that carry no deadline are the first to be released.
Reads wrong when the core role has just got harder. People shed voluntary work under load, which is a sign of good judgment rather than of a job search.
3
The Calendar Thins Out
Fewer self-initiated meetings, more declines, a drift toward being invited rather than convening. Someone who has decided to leave stops building the network they will not need.
Reads wrong when the team has just cut meeting load on purpose, or when the person moved to focused work at their manager's request.
4
Unusual Time Off, or Unexplained Gaps
Single days taken at short notice, midday blocks marked private, a pattern of Tuesday and Thursday mornings. Interviewing has a shape, and calendars record it.
Reads wrong when the explanation is medical, caring, legal or personal. Treating a protected absence as evidence of a job search is where flight risk programs get organizations into real trouble.
5
A Change in Public Professional Activity
A refreshed profile, a burst of new connections in one industry, a conference attended alone. Visible for exactly as long as it takes to notice.
Reads wrong when the person is building a personal brand, recruiting for you, or was told last review to raise their external profile. Surveilling it also costs you more trust than the signal is worth.
6
They Stop Arguing
The person who reliably pushed back on the roadmap now agrees quickly. Disagreement is an investment in a future they expect to be present for, and it is withdrawn before anything else is.
Reads wrong when the last three disagreements went badly. Silence after a dismissal is a psychological safety problem, and it can persist for years without anyone leaving.
7
Planning Stops at a Horizon
Enthusiastic about this sprint, vague about the half. Someone with a start date elsewhere will talk freely about next week and go quiet about next spring.
Reads wrong when the organization itself has no visible plan past the quarter. People mirror the planning horizon they are given.
8
Discretionary Communication Drops
Fewer messages in the channels nobody has to be in. Shorter replies. The social overhead of a job is paid by people who expect to keep it.
Reads wrong when you are measuring it through a tool. Message counts as a proxy for commitment punishes the quiet, the deliberate and anyone in a second language.
9
Development Activity Stalls
The certification lapses, the learning budget goes unspent, the growth plan agreed in January has not been opened since. Development is a bet on staying.
Reads wrong when the plan was never realistic, or when the skills being developed are portable and the learning has simply moved off your platform.
10
Administrative Questions With a Tell
Questions about vesting dates, notice periods, unused leave, reference policy, what happens to a bonus on departure. These are the questions of someone doing arithmetic.
Reads wrong when a vesting cliff, open enrollment or a policy change has just put those questions in everyone's inbox at once.
11
A Significant Life Change
A move, a new baby, a qualification finished, a partner's relocation. Life events reopen decisions that had been settled, including the decision about where to work.
Reads wrong when you use it as an input. Scoring someone higher risk because they had a child is both bad prediction and, in most jurisdictions, the fastest route to a claim. Life events belong in the conversation. Keep them out of the number.
12
A Compensation or Escalation Conversation That Ends
Someone raises pay, title, workload or a conflict, receives an answer, and does not raise it again. The absence of follow-up is read as acceptance about as often as it is acceptance.
Reads wrong when the issue was genuinely resolved. The way to tell the two apart is to go back and ask, which is precisely the conversation 45% of leavers say nobody had with them.
Read down that list and a pattern shows up. Every one of the twelve describes a behavior that has already changed, which means the decision underneath it is at least partly made. Several of them are also things a good manager would be pleased about in a different context. For the closely related pattern of someone who has disengaged and stayed, see the signs of quiet quitting. Same withdrawal, without the exit.
The Distinction That Matters
Lagging Symptoms and Leading Conditions
Flight risk inputs divide cleanly into two families. Symptoms describe what the person is doing, and they change after the decision has begun. Conditions describe what the job is supplying, and they change before it. Most flight risk models are built almost entirely from the first family, then asked to behave like the second.
Input
Family
Typically visible
What it tells you
What it cannot tell you
Resignation
Outcome
Day zero
That the decision is final and the notice period has started.
Anything you can still act on for this person.
Exit interview
Lagging
After notice
A reason, given by someone with nothing left to lose and no stake in your response.
Whether the same reason is live for the four people who stayed.
Behavioral signs (the 12 above)
Lagging
Weeks before notice
That withdrawal has begun, in the cases where it is visible at all.
Why, or what would reverse it. Also silent on anyone who withdraws invisibly.
HRIS attributes (tenure, comp ratio, time since promotion)
Static
Always
Which cohorts have historically turned over. Genuinely useful for planning.
Which member of a flagged cohort is actually at risk. This is why the same names recur every quarter.
Annual engagement survey
Lagging
Once or twice a year
A team-level mood reading from the week it was taken.
What one person needs. A team averaging 3.7 can be two people needing opposite things.
Stay interview
Leading
Whenever you run one
What this person values and whether they are getting it, in their own words.
Anything at all if nobody schedules it. This is the conversation 45% of leavers never had.
Motivator profile
Leading
From week one
Which of 11 intrinsic motivators this individual needs most, scored 0 to 100 against a global norm.
Whether the job is currently supplying them. The profile is the demand side only.
Motivator satisfaction pulse
Leading
Continuously, at team level
Whether the drivers a team needs are being met right now, and which one has come loose.
Who, individually. It reports at team level with a floor of three respondents, by design.
Scroll the table sideways to see all five columns.
Plain text, for a slide or a vendor conversation.
Worth being plain about the last two rows: the profile is individual, and the pulse is team-level with a minimum of three respondents. So a manager gets an individual picture of what someone needs, plus a team reading of which needs are going unmet. A manager's job is to close the distance between those two, and that's a conversation. You can't hand it to a dashboard.
Why the Signs Arrive Late
Every Sign on That List Is Tertiary Creep
There is a failure mode in materials science for a component that deforms permanently under a load it was never supposed to be troubled by, simply because the load never goes away. The discipline calls it creep. Engineers have a standard for it. HR has a signs list.
Creep is time-dependent plastic deformation under sustained load, and the part of it that matters here is that it happens at stresses below the material's yield strength. Nothing is being overloaded. The metal is inside spec, at a temperature above roughly 0.4 of its absolute melting point, holding a load it is rated for, and it deforms anyway.
It does this in three stages. Primary creep is quick and decelerating. Secondary creep is a long, nearly constant crawl that can run for ten years or more. Tertiary creep is the short final stage where the rate climbs steeply and the component fails.
Here is the useful part. During secondary creep, which is most of the component's life, the crawl is slow enough that looking at the part tells you very little. It looks like a new part. By the time the deformation is obvious, most of the life is gone, because tertiary creep is a short final stage against a service life measured in years.
So nobody responsible for a turbine relies on looking at the blade. Inspection is the backstop, and there is plenty of it: borescopes, tip-clearance and elongation measurements, replication for cavitation. The primary instrument is the two things that cause creep in the first place, hours at temperature and load. Those are known from the first day of service, they're continuous, and they don't need the damage to have happened yet.
The twelve signs are the visible deformation. They're real, they're diagnostic, and they show up in the last short stretch. The conditions underneath them, what this person needs from the work and whether their team is getting it, have been readable the entire time.
01
The Load Is Individual
Two people in the same role under the same manager are carrying different loads, because they need different things from the work. One is starved of autonomy and fine on recognition. The other is the reverse. A team-level engagement score averages them into a number that describes neither.
02
The Deformation Is Slow and Then Sudden
Gallup's finding that 77% of leavers went within three months of starting to search, or never searched at all, is the tertiary stage described from the outside. The decision looks abrupt to the organization because the long part of it was invisible.
03
Inspection Frequency Is the Real Constraint
An annual survey samples the condition once a year. A quarterly dashboard fed by HRIS attributes samples something that barely moves. Neither cadence can catch a change that happens in a month, however good the instrument is.
04
Nobody Asked What the Part Was Rated For
Most organizations have never established what each person actually needs from their work. Without that baseline there is no way to tell a heavy load from a light one, so every reading has to be interpreted against a company average that fits almost nobody.
Copy and Run It
An Employee Flight Risk Assessment You Can Actually Run
Two worksheets, deliberately separated. The first is what a line manager fills in about one person, and it leads with conditions before symptoms. The second is what HR aggregates, and it carries the suppression rules that stop the first one from becoming a watch list. Both are plain text on purpose, because calendar and rich-text fields collapse runs of spaces and the column alignment is what makes them readable.
Worksheet A: The Manager's Read on One Person
Stays with the manager, and is written so you could show it to the person it describes.
EMPLOYEE FLIGHT RISK WORKSHEET (A)  ---  one person, one manager, 10 minutes

Score each line 0, 1 or 2.   0 = no concern   1 = unsure   2 = concern

PART 1. CONDITIONS  (what the job is supplying)          weight x2
  C1  I could not name the two things this person
      most needs from work without guessing.              [ ]
  C2  One or both of those is missing from their
      role, or present below the level they need.         [ ]
  C3  Something changed in the last 90 days that
      reduced one of them (reorg, new manager, scope).    [ ]
  C4  They have raised something in the last 6 months
      that is still unresolved.                           [ ]
  C5  They could not describe a version of their job
      12 months out that they would want.                 [ ]
  C6  Their pay and level would not hold up against
      what they would be offered outside today.           [ ]
                                      Part 1 subtotal  [    ] x2 = [    ]

PART 2. OBSERVATIONS  (what the person is doing)         weight x1
  O1  Discretionary work has narrowed to the role.        [ ]
  O2  They have stepped back from optional commitments.   [ ]
  O3  They have stopped disagreeing.                      [ ]
  O4  Planning conversations stop at a near horizon.      [ ]
                                      Part 2 subtotal  [    ] x1 = [    ]

PART 3. EXPOSURE  (what it would cost to lose them)      weight x1
  E1  No identified successor or backup.                  [ ]
  E2  Holds knowledge that is not written down.           [ ]
  E3  Replacement ramp is longer than one quarter.        [ ]
                                      Part 3 subtotal  [    ] x1 = [    ]

                            TOTAL (0-38, a sort key)  [        ]

THE TOTAL SORTS A LIST. THE TWO AXES DECIDE THE ACTION.
  LIKELIHOOD  = Part 1 + Part 2, out of 32.  High at 16 or more.
  EXPOSURE    = Part 3, out of 6.            High at 4 or more.

  High likelihood, high exposure   Act this week. Stay interview
                                   inside 14 days with one thing
                                   you will change already decided,
                                   and start the handover too.
  High likelihood, low exposure    Book the stay interview, ask
                                   properly, accept the answer.
  Low likelihood, high exposure    They are probably staying, and
                                   you are exposed anyway. Document
                                   and name a backup this quarter.
  Low likelihood, low exposure     Keep the normal one-on-one.

  Where the total and the quadrant seem to disagree, the
  quadrant wins. A combined total cannot tell retention work
  apart from succession work, and those are different jobs.

THE ONE QUESTION THAT DOES MOST OF THE WORK
  If C1 scored 2, stop scoring. You do not have enough information
  about this person to assess anything, and that is the finding.

DO NOT SCORE
  Life events, caring responsibilities, medical or protected absence,
  pregnancy, age, visa or immigration status, external profile activity.
  These belong in a conversation. They do not belong in a number.
Plain text, alignment preserved. On a phone the block scrolls sideways; the copy button is easier.
Part 1 is weighted double on purpose. Six questions about conditions outrank four about behavior, because the conditions were readable months earlier and the behavior was not.
The Employee Flight Risk Matrix: Likelihood Against Exposure
Derived from Worksheet A, so the placement is scored rather than asserted.
Worksheet A gives you two numbers, and they answer different questions. Parts 1 and 2 together give likelihood, out of 32. Part 3 on its own gives exposure, out of 6. Plot one against the other and the action falls out, which is the part a single 0 to 38 total hides.
Exposure (Part 3)
High exposure · Low likelihoodSingle Point of Failure
They are probably staying, and you would be in trouble if they did not. The risk here is your own dependency. Write down what only they know and name a backup this quarter.
High exposure · High likelihoodAct This Week
Stay interview inside 14 days, with one thing you are willing to change already decided before you walk in. Start the knowledge transfer in parallel, because you may lose this either way.
Low exposure · Low likelihoodRoutine
Nothing here needs a program. Keep the one-on-one, and re-run the sheet if something structural changes around them.
Low exposure · High likelihoodLet the Conversation Decide
Book the stay interview, ask properly, and accept the answer. If they leave anyway the team absorbs it, so this is the quadrant where an honest conversation costs you least.
Likelihood (Parts 1 + 2) →
Cut points: likelihood is high at 16 or more out of 32, exposure at 4 or more out of 6. Both are judgment, and they're yours to move once you've run the sheet across a team. Where the worksheet's total and the quadrant seem to disagree, the quadrant wins: the 0 to 38 total is there to order a list, and a single combined number cannot tell retention work apart from succession work.
A Worked Example
The same sheet, filled in.
Priya is a senior analyst, four years in, reorganized under a new manager in June. Her manager fills in Worksheet A.
PART 1. CONDITIONS                                    score
  C1  Could not name her two needs without guessing       1
  C2  One is missing or below the level she needs         2
  C3  Something in the last 90 days reduced one           2
  C4  Raised something in 6 months, still unresolved      2
  C5  Could not describe a job she would want in 12 mo    1
  C6  Pay and level would not hold up outside             1
                                 subtotal 9  x2  =       18

PART 2. OBSERVATIONS
  O1  Discretionary work narrowed to the role             1
  O2  Stepped back from optional commitments              2
  O3  Stopped disagreeing                                 2
  O4  Planning stops at a near horizon                    1
                                 subtotal 6  x1  =        6

  LIKELIHOOD (Parts 1 + 2)                               24  / 32   HIGH

PART 3. EXPOSURE
  E1  No identified successor or backup                   2
  E2  Holds knowledge that is not written down            2
  E3  Replacement ramp longer than one quarter            1
                                 subtotal 5  x1  =        5

  EXPOSURE                                                5  / 6    HIGH

  TOTAL (sort key)                                       29  / 38

  QUADRANT: high likelihood, high exposure  ->  ACT THIS WEEK

WHAT THE SHEET ACTUALLY TOLD HER MANAGER
  A place to start. C1 scored 1, so he half knows what she
  needs and is not sure. C3 and C4 both scored 2, and they point at
  the same thing: something changed in June and the thing she raised
  about it is still open. That is the conversation, and it is a more
  specific one than a risk percentage would have produced.
Plain text, alignment preserved. On a phone the block scrolls sideways; the copy button is easier.
Worksheet B: The HR Aggregate, and the Rules That Keep It Safe
For the people team. Contains no individual names.
EMPLOYEE FLIGHT RISK ROLL-UP (B)  ---  per team, per quarter

  Team                                          ______________
  Headcount in scope (minimum 4)                ______________
  Worksheets returned                           ______________
  Share of worksheets where C1 scored 2         ______________  %
  Share with likelihood 16+                     ______________  %
  Stay interviews booked in the last 30 days    ______________
  Of those, how many produced a change          ______________

SUPPRESSION RULES  (apply before anything leaves this sheet)
  1. Do not report a team of fewer than 4. Below that, a percentage
     names an individual.
  2. Do not publish individual scores anywhere the person could be
     identified, including to their skip-level.
  3. Do not carry a score forward more than one quarter. A stale
     flight risk score is a label, and labels change how people
     are treated.
  4. Report the C1 rate first, and to leadership, before any risk
     score. A high C1 rate means your managers lack a
     basic read on their own people, which is its own finding.
  5. If a likelihood 16+ read produced no booked conversation within
     30 days, delete the score. An assessment nobody acts on is
     a record you are keeping about someone for no reason.

THE NUMBER TO TRACK QUARTER ON QUARTER
  The share of at-risk reads that produced a conversation, and
  the share of those conversations that produced a change the
  person could point to.
Plain text, alignment preserved. On a phone the block scrolls sideways; the copy button is easier.
Where this does not apply, and what it is not.
This is a structuring device, and it has never been validated against outcomes. It has not been tested, it produces no probability, and the cut points are judgment. It assumes a manager who knows the person, a span small enough to fill it in honestly, and an organization where a stay interview is a normal thing to book. It breaks on wide spans, on shift and frontline work where one-on-ones are not scheduled, in unionized settings where an individual retention conversation may cut across agreed process, and in high power-distance cultures where the direct version of C4 will return a polite zero from everyone. Where it breaks, the questions still work as an agenda. The scoring is the part to drop.
The Response
What Do You Do About a Flight Risk Employee?
Book a conversation, decide one thing you will change before you walk into it, and separate the retention question from the continuity question. The order below runs from the cheapest move to the most expensive, and most of the value sits in the first three.
01
Ask, Within 14 Days
A stay interview, scheduled as a normal thing rather than an intervention. What do you want more of, what do you want less of, what would make the next twelve months worth staying for. Our stay interview questions are the long version. The deadline matters more than the script.
02
Change One Thing, Visibly
Pick the smallest item they named that you can actually move, move it inside a month, and tell them that is why it moved. A conversation that changes nothing is worse than no conversation, because it converts a grievance into evidence.
03
Go Back to the Thing They Already Raised
Sign 12 on the list above: someone raised something, got an answer, and stopped raising it. Reopening a closed item costs one sentence. 42% of leavers say something could have been done, and reopening is often where that something is hiding.
04
Fix the Role Before You Fix the Offer
Compensation was the largest bucket at 30%, so sometimes the answer really is money. For the rest, who named something other than pay, a raise tends to buy a delay. Establish which one you are in before you spend, because the wrong fix costs you the money and the person.
05
Reduce Exposure in Parallel
Retention and continuity are two projects. Documenting what only they know, naming a backup and starting a handover are worth doing whether or not they stay, and doing them openly is not an insult if the reason you give is honest.
06
Check Whether It Is One Person or the Team
If three people on one team land in the same quadrant, treat that as one finding about the team. It's a manager or a structure question, and the metrics for it are on our manager effectiveness metrics page.
One thing that is not on the list: the counteroffer. By the time there is another offer to counter, the conditions that produced the search have been in place for months, and you are bidding against a decision rather than changing the thing that caused it.
The Part Most Guides Skip
Where Employee Flight Risk Scoring Goes Wrong
A flight risk score is a prediction about a person, held by their employer, which they usually cannot see and cannot correct. That is a category of data with its own failure modes, and they're worth naming before you build the dashboard, while the design is still open.
It Becomes Self-Fulfilling
Label someone a flight risk and the treatment changes. They stop being given the long project, stop being told about the reorg, stop being the obvious name for the stretch assignment. Every one of those is a rational hedge, and together they manufacture exactly the outcome the score predicted.
Several Good Predictors Are Illegal Inputs
Life stage, caring load, visa dependency and health events all correlate with departure, and using them to score someone is discrimination in most jurisdictions regardless of predictive value. A model that quietly reaches them through a proxy has the same problem with an extra layer.
The Accurate Ones Are Often Undiscussable
The strongest signal a manager has is usually something they have noticed and cannot evidence. It doesn't survive contact with a scoring sheet, so it never enters the system, and the system ends up running on the weak signals that happen to be machine-readable.
Precision Without Action Trains People to Ignore It
A model that flags the same forty names every quarter is right about the cohort and useless to a manager. After two quarters of alerts that led nowhere, the alert has been reclassified as noise. That's a worse position than having no model at all.
The way through all four is to make the output an agenda for a conversation. A reading that produces a question for the next one-on-one is hard to misuse, doesn't need to be hidden from the person it describes, and fails safely when it's wrong. A reading that produces a ranked list of names needs governance that most organizations have not written. Our stay interview questions are the conversation this is supposed to end in.
Before the signs
You Can Watch for Every One of the 12 Signs and Still Get the Resignation Cold
A 20-minute call, your current flight risk inputs on the screen, and an honest read on which of them are lagging, which are static, and what a leading one would look like in your org.
No preparation needed. Bring whatever your current model reads.
Where Attuned Fits
Reading the Condition Instead of Waiting for the Deformation
Attuned is two instruments. A 10-minute assessment that scores one person's 11 intrinsic motivators. That's the demand side, and it's individual by design. And a recurring satisfaction pulse on whether those drivers are being met, which is the supply side and reports at team level with a floor of three respondents. Neither one is a per-person flight risk score: the profile describes what a person needs, and the pulse reads whether a team is getting it.
Step 0 · The Assessment
Establish What Each Person Is Rated For
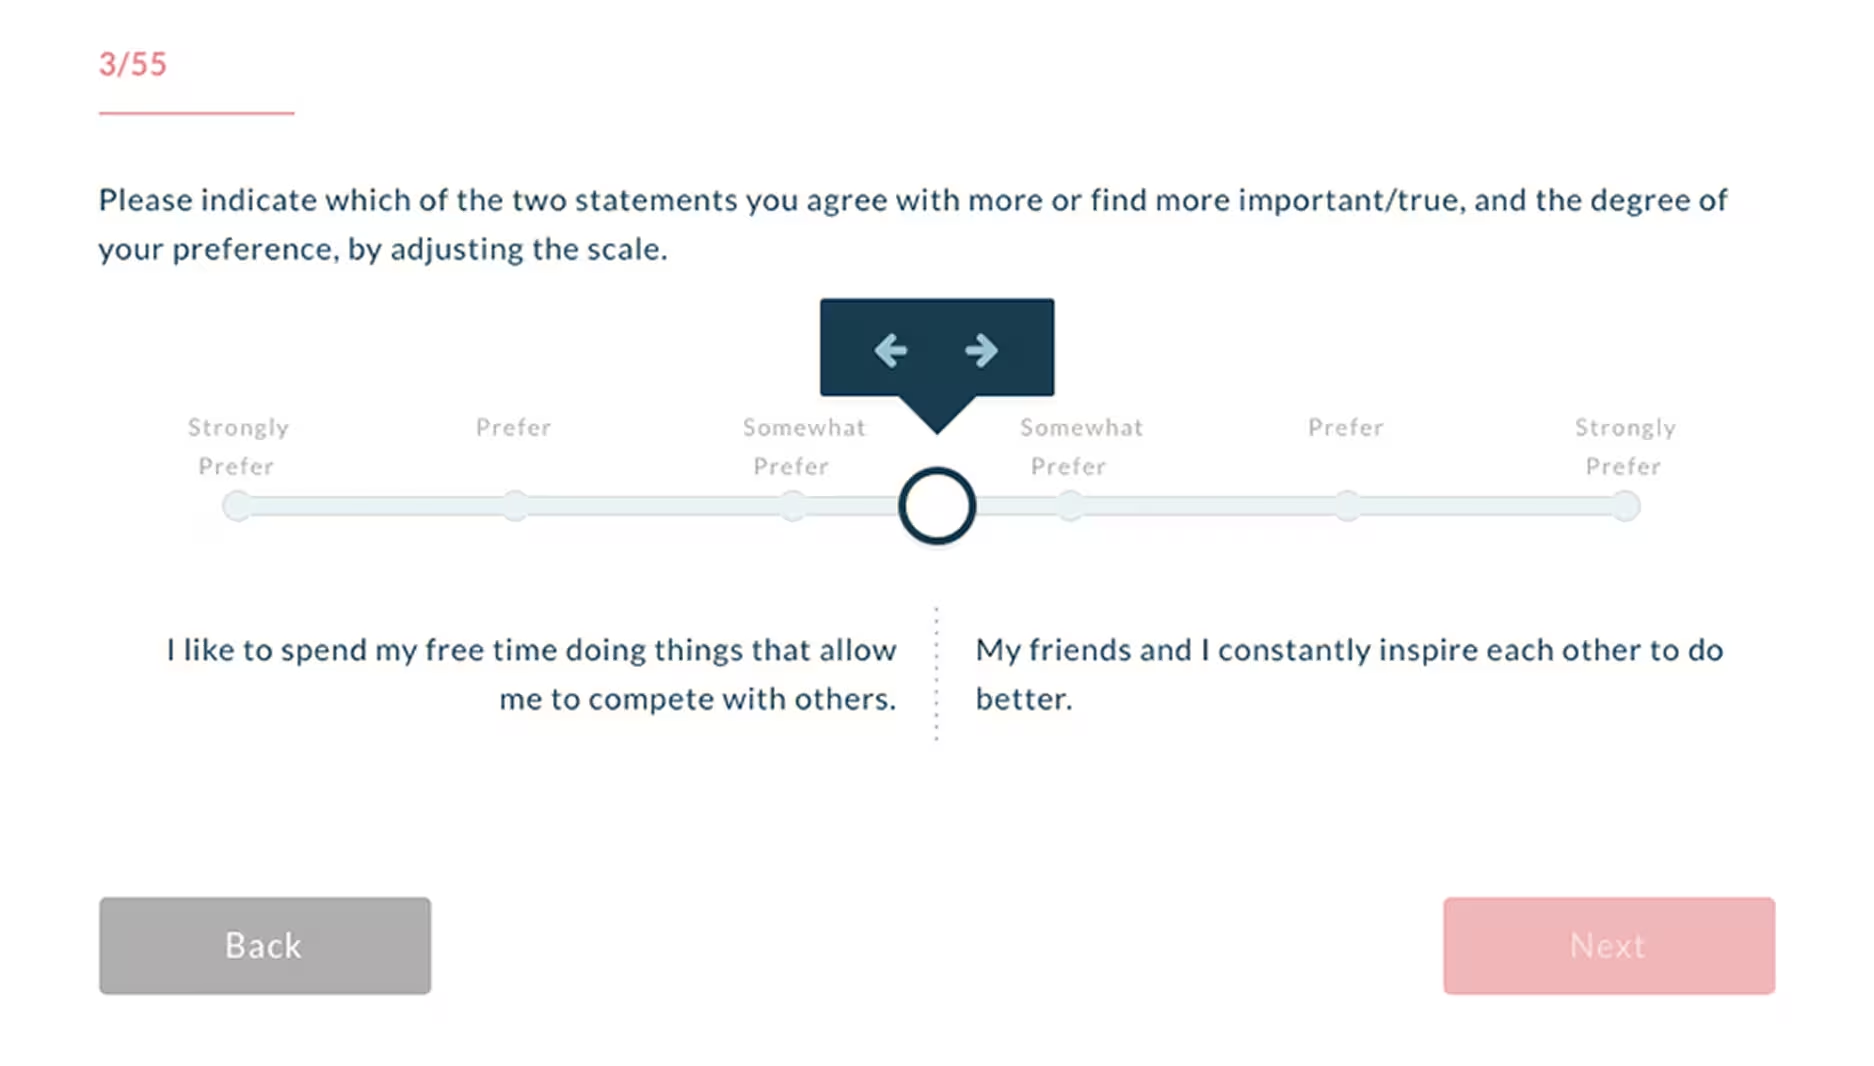
The Intrinsic Motivation Assessment runs 55 forced-choice questions in about 10 minutes and scores all 11 motivators from 0 to 100 against a single global norm, labeling each one Need-to-have, Nice-to-have or Neutral. This is the answer to question C1 on the worksheet above, established once in week one rather than guessed at during a crisis. People own their own data and choose what is shared.
The assessment: forced-choice, 55 questions
10 minper person
11motivators scored
0-100against one global norm
10,000+people assessed, four generations
1
A Named Need, Rather Than a Percentile
A flight risk model outputs a number about a person. A motivator profile outputs a sentence: this person needs autonomy and progress, and is neutral on status. One of those can be discussed with the person it describes. The other usually cannot.
2
The Supply Side Is Sampled Continuously
The satisfaction pulse runs on a short recurring cycle, so a driver coming loose is visible in weeks. Sampling frequency is what decides whether a change that takes a month is ever seen, and no amount of instrument quality substitutes for it.
3
The Output Is an Agenda for the Next One-to-One
AI TalkCoach turns one person's profile and the current team-level gaps into what to ask in the next one-on-one. That's the form of output that survives being wrong, and a flight risk read is wrong a great deal of the time.
4
It Runs Under Whatever Model You Already Have
Keep the HRIS-driven cohort model for workforce planning, where it's genuinely good. Add a leading, individual read underneath it for the part that model has never been able to do: telling one manager what to say.
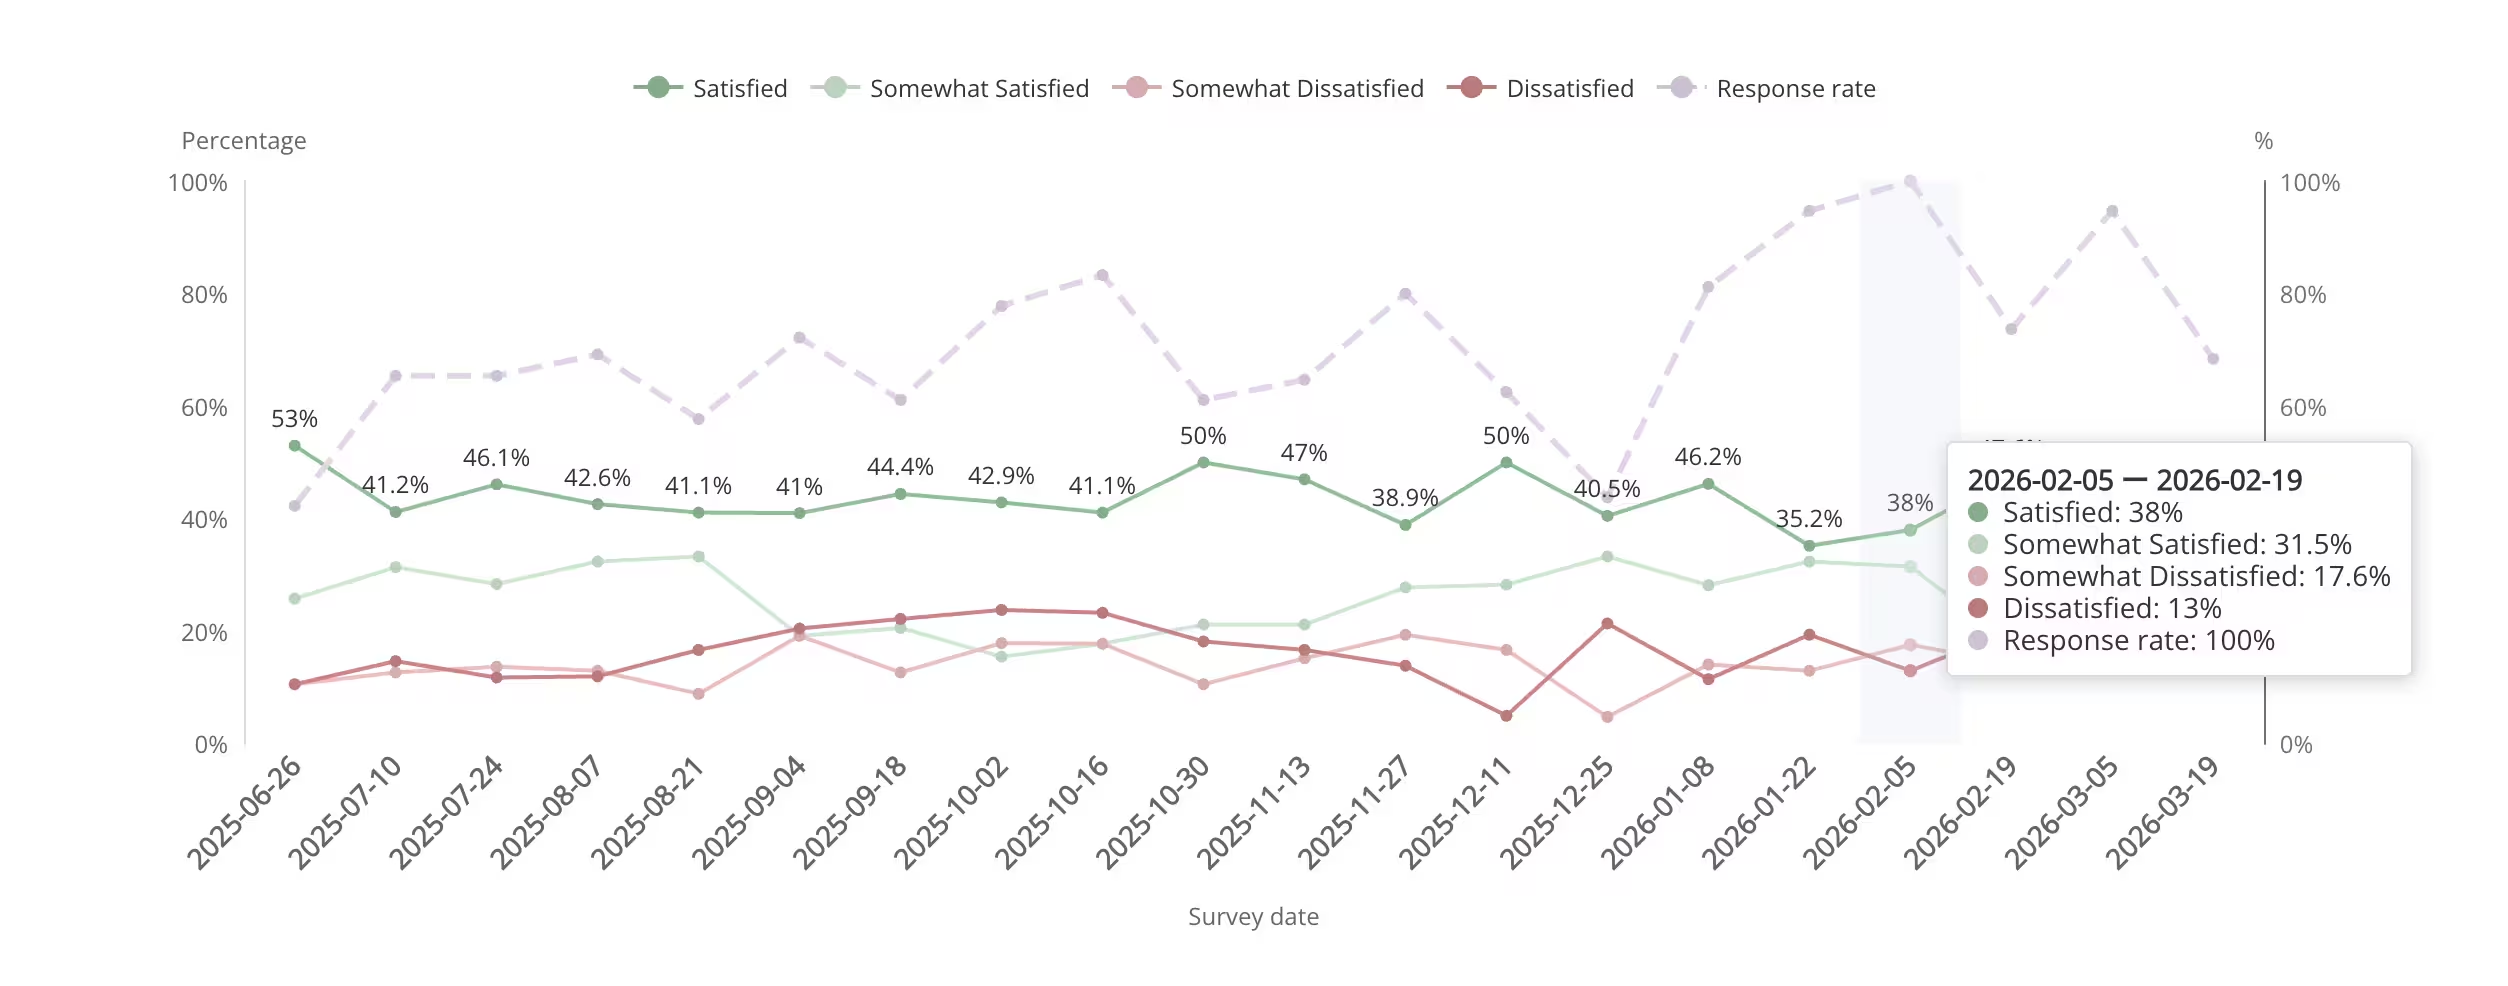
Satisfaction over time
Watching a Driver Come Loose
Satisfaction is tracked against the drivers a team scores highest, so a downward slope names which driver slipped and roughly when it started. The claim is a narrow one: it's a leading indicator relative to turnover, exit interviews and the annual survey, all three of which report decisions that were already taken. It is still a team-level reading, and turning it into a statement about one person is the manager's job, in a conversation.
Motivator satisfaction, tracked over time
Featured Case Study
A Firm That Found Out at the Exit Interview
Azon Recruitment Group is an Irish recruitment firm, so the specifics are theirs. What transfers is the failure mode this whole page is about, and it arrived with no flight risk model involved at all. We have no before-and-after on a flight risk program to show you here, and we would rather say so than dress this up as one.
An award-winning Irish recruitment agency, and one of the country's fastest-growing talent providers.
Azon's read on how people were doing rested on body language and on what surfaced through their managers, until a resignation proved the instinct wrong. "Typically, if an employee was engaged and they looked like they were happy, the assumption would be they were fine," says Denise Grant, Manager for HR Recruitment at Azon, "until you get their resignation and you realize at an exit interview that they weren't as happy as you had assumed." Read that against the twelve signs above. The people she describes presented none of them. Looking happy and being satisfied are different measurements, and only one of them was being taken. Attuned gave Azon a measured, individual view of what each person valued, so an impression could be checked against something specific.
"Being able to get to the nub of people's underlying motivations at the start of a process and see what really drives and motivates people in the workplace has been very helpful when trying to hire, and we've seen a dramatic increase in the numbers of people we hire that we feel we've gotten right, and that are a right fit for the business."
Kevin Halligan, Associate Director, Banking & Financial Services, Azon
"Since beginning to use the software, we have really seen that benefit translating to earnings for our business."
Kevin Halligan, Associate Director, Banking & Financial Services, Azon
Go Deeper
Resources for the Conversation This Is Supposed to End In
A score identifies someone. These cover what to say next, which is the part where most flight risk programs quietly stop.
Preventing Unwanted Turnover
Our whitepaper on the turnover you did not want, what actually drives it, and the interventions that move it. The closest thing we have published to a full treatment of this page's subject.
Motivator profiles from 10,000+ people across four generations, including how driver profiles differ by role and seniority. The empirical basis for the condition side of everything above.
Why Retention Rate Is Not the Metric You Are Looking For
The case against the population number, and what to watch instead. Directly relevant if your flight risk reporting currently starts from an attrition percentage.
Flight risk concentrates in the people you can least afford to lose, and the mechanism is usually something the organization is doing rather than something it failed to offer.
Sign 6 above, the person who stops arguing, usually points to a safety problem, which can look like a flight problem. This is how to tell which one you have.
Fourteen metrics that describe the manager, each with the conditions under which it reads wrong. Useful if the flight risk pattern in your data clusters under particular managers.
Most Flight Risk Tools Score the Person. This One Measures What the Job Is Supplying Them
It Reads the Condition While the Damage Is Still Reversible
Eleven motivators per person, scored once, and a team-level pulse on whether the work is delivering them. Both halves are readable from week one, long before any of the twelve behavioral signs would be visible.
It Is Ahead of the Three Things You Have Now
Turnover, exit interviews and the annual survey all report decisions that were already taken. A satisfaction pulse on a short cycle is ahead of all three. That's a narrow claim, and it's the one we can actually stand behind.
The Pulse Stops at the Team, by Design
Motivator profiles are individual, and people own their own data. The satisfaction pulse reports at team level with a minimum of three respondents, and that floor is deliberate. A per-person satisfaction reading held by an employer carries the governance burden set out above, and the three-respondent floor is what keeps this instrument on the safe side of it.
Built With Psychologists, and Plain About the Evidence
Attuned worked with psychologists to define 11 workplace motivators, each scored 0 to 100 against a single global norm, so a 72 means the same thing in Tokyo and in Texas. It sits in the same family of self-report instruments as the Reiss Motivation Profile (Reiss, 2004) and Amabile's Work Preference Inventory (1994). We have not published a peer-reviewed validation paper, and we do not claim one. The full comparison is on our intrinsic motivation assessment page.
FAQ
Employee Flight Risk: Common Questions
What is a flight risk employee?
A flight risk employee is someone an organization judges to be likely to resign within a defined window, usually the next six to twelve months. The term describes a forecast about one named individual, which distinguishes it from turnover or attrition, both of which are rates measured across a population after people have already gone. A flight risk judgment is only useful if it arrives early enough to act on, and only defensible if the organization can say what it was based on.
How do you identify flight risk employees?
Most organizations combine three inputs. Behavioral observation, where a manager notices that discretionary work has narrowed, optional commitments have been released or planning conversations have stopped at a near horizon. Record attributes held in the HRIS, such as tenure, time since last promotion and compensation ratio, which identify cohorts that have historically turned over. And survey data, usually annual. All three describe either the past or a change that has already begun. The input that moves earliest is condition data: what each person needs from the work, and whether their team is currently getting it. Both are readable from week one, and neither requires anything to have gone wrong yet.
What is a flight risk assessment in HR?
A flight risk assessment is a structured process for estimating how likely a given employee is to leave and what it would cost to lose them. In practice it takes one of two forms. A model, usually built in an HR analytics platform, that scores the whole population from record attributes and survey history. Or a worksheet, completed by the line manager, that turns an impression into something reviewable. The worksheet on this page is the second kind, and it is a structuring device with no validation behind it: it produces no probability, we have not tested it against outcomes, and the cut points are judgment.
What does retention risk mean?
Retention risk is flight risk weighted by consequence. Two people can be equally likely to resign while presenting very different retention risk, because one holds undocumented knowledge with no identified successor and a six-month replacement ramp, and the other does not. Flight risk asks how likely someone is to go. Retention risk asks what it would cost you if they did. The number most retention programs are actually trying to move is regretted attrition, the share of departures the organization would have paid to prevent, and most dashboards do not separate it out.
How can you tell if someone is a flight risk?
The reliable tell is a conversation, and the observable tells are weak. Behavioral changes such as narrowed output, withdrawal from optional work, a thinning calendar or planning that stops short are genuine signals, and each has a common innocent explanation, which is why watch lists built on them generate false positives until managers stop trusting the alerts. Gallup found that 45% of people who left voluntarily say no manager or other leader proactively raised their satisfaction, performance or future with them in the three months before they went. Asking is both more accurate and more available than watching.
Is there an employee flight risk calculator or template?
This page carries two, and they're free to copy. Worksheet A is a per-person manager worksheet with thirteen scored lines across three parts, conditions, observations and exposure, weighted so that the conditions count double. The 0 to 38 total sorts a list; the action comes from two axes, likelihood out of 32 and exposure out of 6. Worksheet B is the team-level roll-up for the people function, and it carries the suppression rules that keep the first worksheet from becoming a watch list, including a minimum team size of four and a rule that deletes any high score which produced no conversation inside thirty days. Both are plain text with the column alignment preserved, because calendar and rich-text fields collapse runs of spaces.
What is an employee flight risk matrix?
A flight risk matrix plots how likely someone is to leave against how much it would cost to lose them, so that two people with the same risk score get different responses. The version on this page is derived from the worksheet above: parts one and two give likelihood out of 32, part three gives exposure out of 6, and the four quadrants are Routine, Single Point of Failure, Let the Conversation Decide, and Act This Week. Plotting the two axes separately is what a single combined total hides, because a highly exposed person who is probably staying needs documentation and a successor, while an equally scored person nobody depends on needs a conversation.
What are the signs an employee is about to quit?
The twelve most commonly cited are: output narrowing to the job description, withdrawal from optional work, a thinning calendar, unusual or unexplained time off, a change in public professional activity, a stop in disagreement, planning that stops at a near horizon, a drop in discretionary communication, stalled development activity, administrative questions about vesting or notice, a significant life change, and a compensation or escalation conversation that simply ends. Each of the twelve has a documented condition under which it means something else, set out in full above. Two of them, life events and external profile activity, should stay out of any scoring model entirely.
Should you ask an employee directly whether they are thinking of leaving?
Yes, and the structured version of that conversation is a stay interview. The common objection, that asking plants the idea, does not survive contact with the evidence: Gallup reports that 42% of people who left voluntarily say their manager or organization could have done something to prevent it, with compensation and benefits named by 30% and positive manager interactions by 21%. Those are answerable only if someone asks while the person is still there. The practical form is to ask what they need from the work, what they are getting, and what has changed. Asking someone whether they are interviewing gets you a polite answer and very little else.
Should employees be told their flight risk score?
If the answer is no, that's a strong signal the score shouldn't exist in that form. A prediction about a person, held by their employer, which they cannot see and cannot correct, changes how they are treated: they stop being given the long project and stop being the obvious name for the stretch assignment, and those rational hedges produce the departure the score predicted. The safer design is an output the person could read without harm, which in practice means an agenda for a conversation instead of a ranked list of names. If you do keep individual scores, write the governance first: who can see them, how long they persist, and what deletes one.
What does employee flight risk cost?
Replacement cost is the visible part and the part every business case uses, though the figure varies widely by role and the commonly quoted multipliers are estimates and worth treating as such. The larger and less visible cost sits upstream. Gallup puts the cost of low engagement to the world economy at roughly $10 trillion in lost productivity, about 9% of global GDP, with 20% of employees engaged in 2025, the lowest level it has recorded since 2020. Most of that is paid by people who never resign at all. For the metrics side of the question, see our guide to turnover metrics every CEO should track.
Will a pay raise fix flight risk?
Sometimes, and it is the single most cited fix: of the people Gallup asked who said their departure was preventable, 30% named compensation or benefits. Look at what the other 70% named, which includes positive manager interactions at 21%, organizational issues at 13%, career advancement at 11% and staffing or workload at 9%. A pay raise offered to someone whose actual unmet need is autonomy or progress buys a delay, and the resignation tends to arrive later at a higher salary. Knowing which of the two you are looking at is the entire value of measuring what the person needs before you make the offer.
How is flight risk different from quiet quitting?
They share a mechanism and separate at the exit. Both describe someone who has withdrawn discretionary effort and narrowed their work to the role description. Flight risk assumes that withdrawal ends in a resignation. Quiet quitting describes the same withdrawal in someone who stays, often for years, which is more expensive in aggregate and far less likely to trigger any response, because nothing ever happens that forces the organization to notice. The early signals are close to identical, which is one more reason to read the condition underneath the behavior.
Employee Flight Risk
You Will Find Out Eventually. The Only Question Is Whether It Is at the Exit Interview
Bring whatever your current model reads. We will sort the inputs into lagging, static and leading, show you how much of your flight risk picture is made of things that have already happened, and be straight about where Attuned adds nothing you do not already have.
20 minutes
10,000+ people assessed
No preparation needed
Talk to Attuned
A working session on how your organization currently reads employee flight risk.
 The assessment: forced-choice, 55 questions
 Motivator satisfaction, tracked over time