
Added details on the Motivator Evaluation graph show priorities more clearly
Why?
We received a request from one of our customers to make the following enhancements to the Motivator Evaluation graph:
To add an indicator showing the number of people that have a given motivator in their top six, as well as displaying the weather icon for the latest survey.
To display the same content that can be accessed via the Dashboard alongside the Motivator Evaluation & Trend views.
The details:
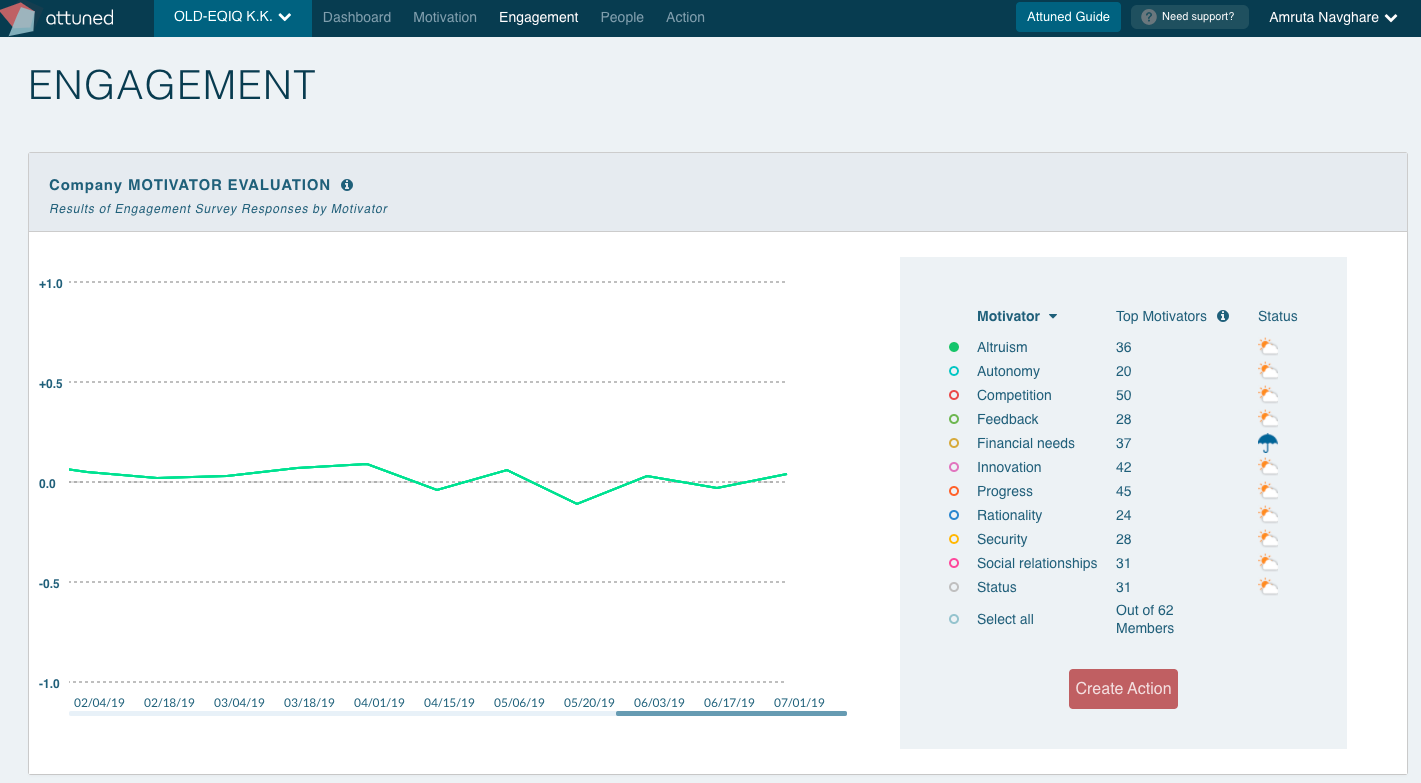
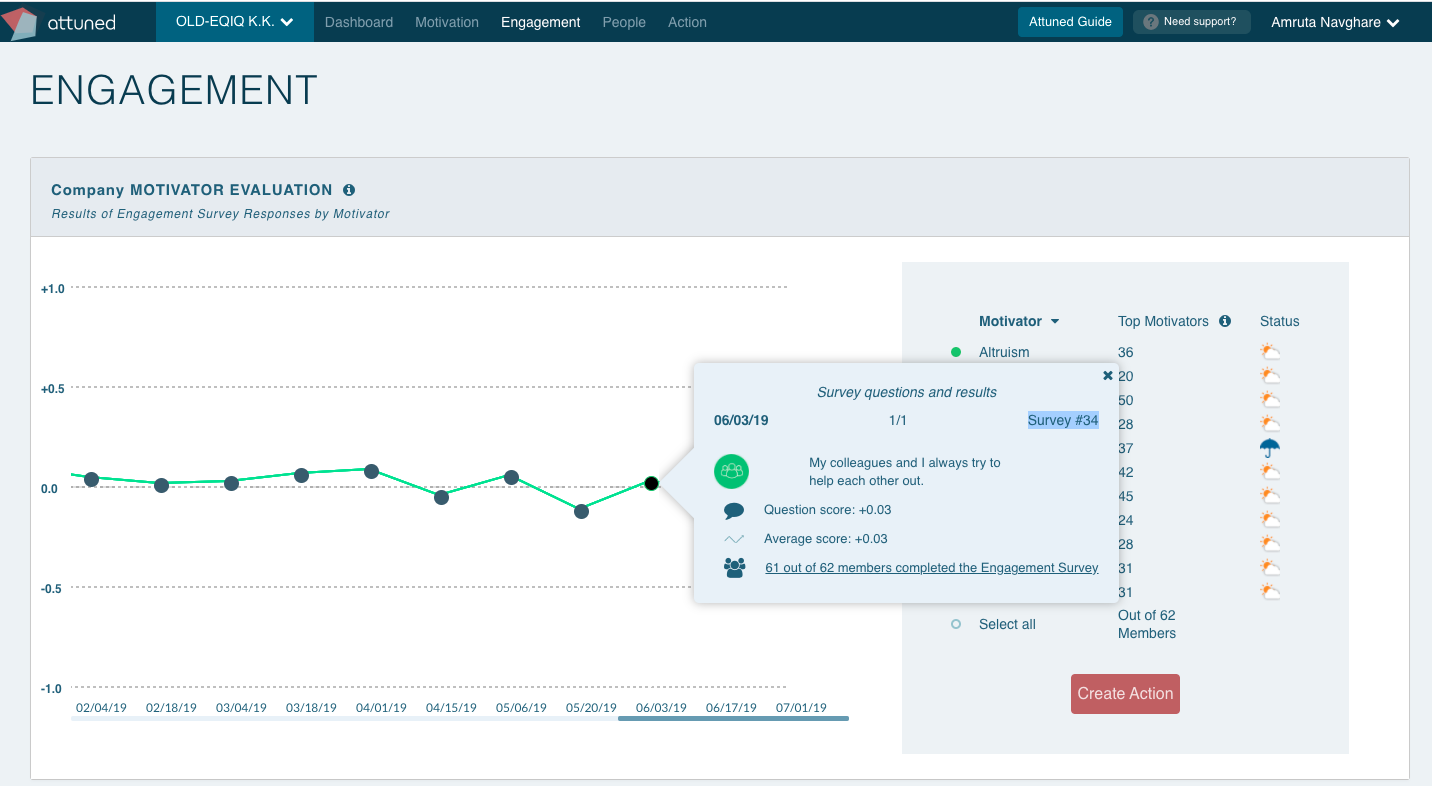
Based on these suggestions, we created the following design, adding the same data that is displayed on the Dashboard to the right of the Motivator Evaluation charts:
Name of motivator.
The number of people who have that motivator in their top six.
The weather icon for that motivator.
We’ve also made it possible to sort the whole list—either high to low (default) or low to high—for the Motivator, Members’ Top Motivators and Status columns.
The Survey number has been added to the Motivator Evaluation graph pop-up.
Coming Soon! The Startup Guide!
The details:
The Startup Guide is designed to make using Attuned super easy and intuitive for newly onboarded users. The Guide is composed of two parts—the Checklist and the Tour—each of which will differ depending on the user’s role (e.g. Admin/Team Manager/Owner).
The Checklist:
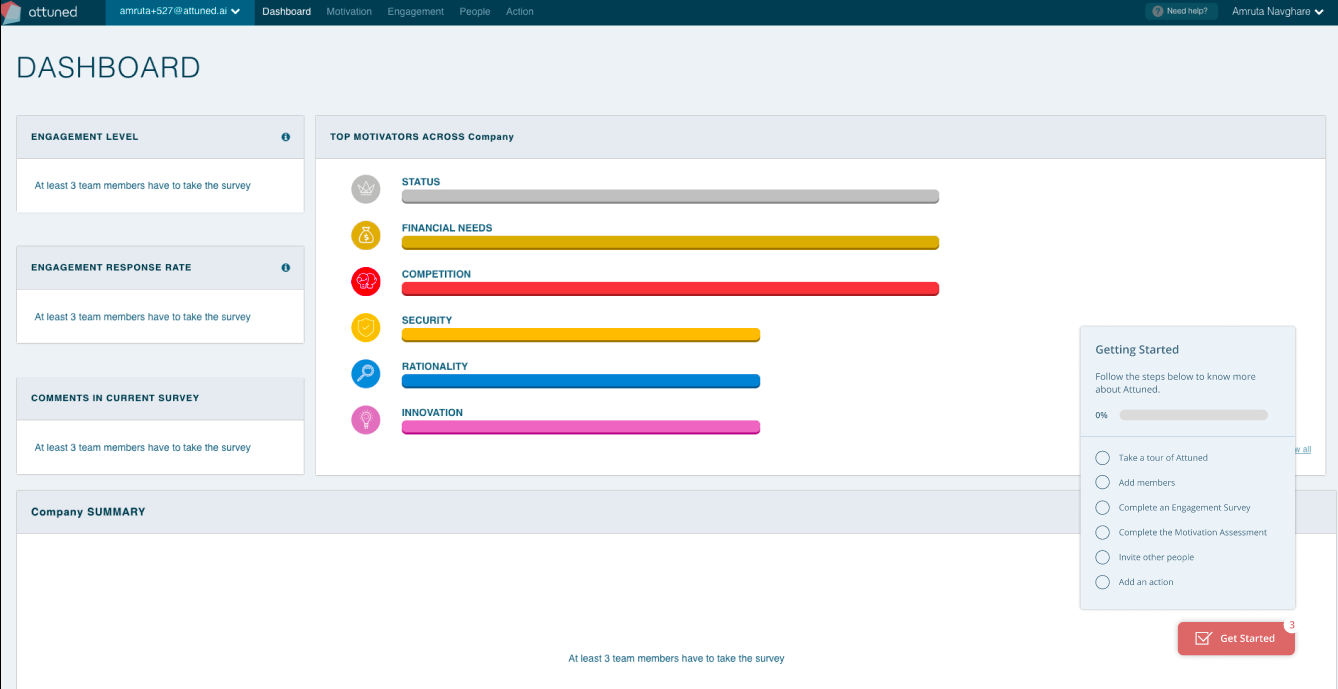
When the user loads the Dashboard for the first time, all the Checklist items will be displayed on the Getting Started menu.
The Getting Started menu can be opened and closed by clicking on the numbered indicator on the ‘Get Started’ button. Once minimized, the Getting Started menu will stay like this until opened again.
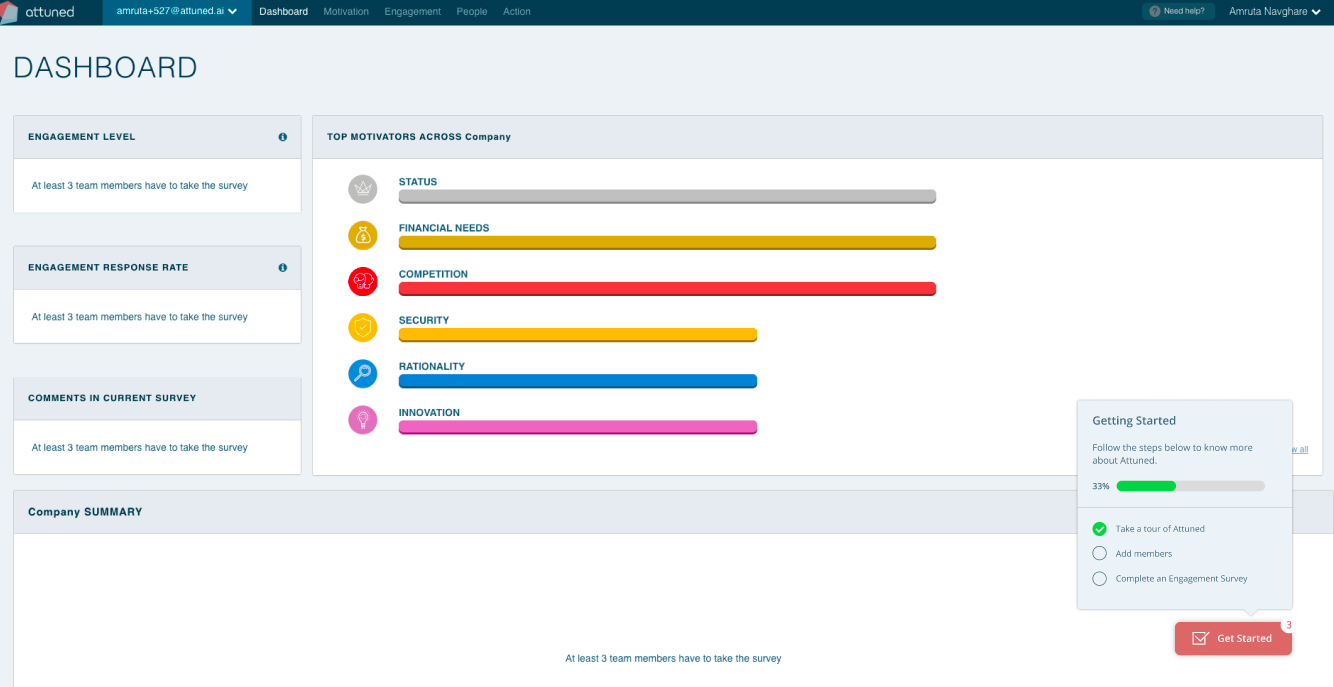
After each item has been completed, the numbered indicator will change to show how many outstanding items remain, while the Status bar will also be updated accordingly.
The first item in the Checklist is a link to the Tour; the others are activities, the status of which (‘Done’ or ‘Not Done’) depends upon actions taken within the Attuned application.
Once all of the items on the Checklist have been completed, the Getting Started menu will no longer be displayed.
The Tour:
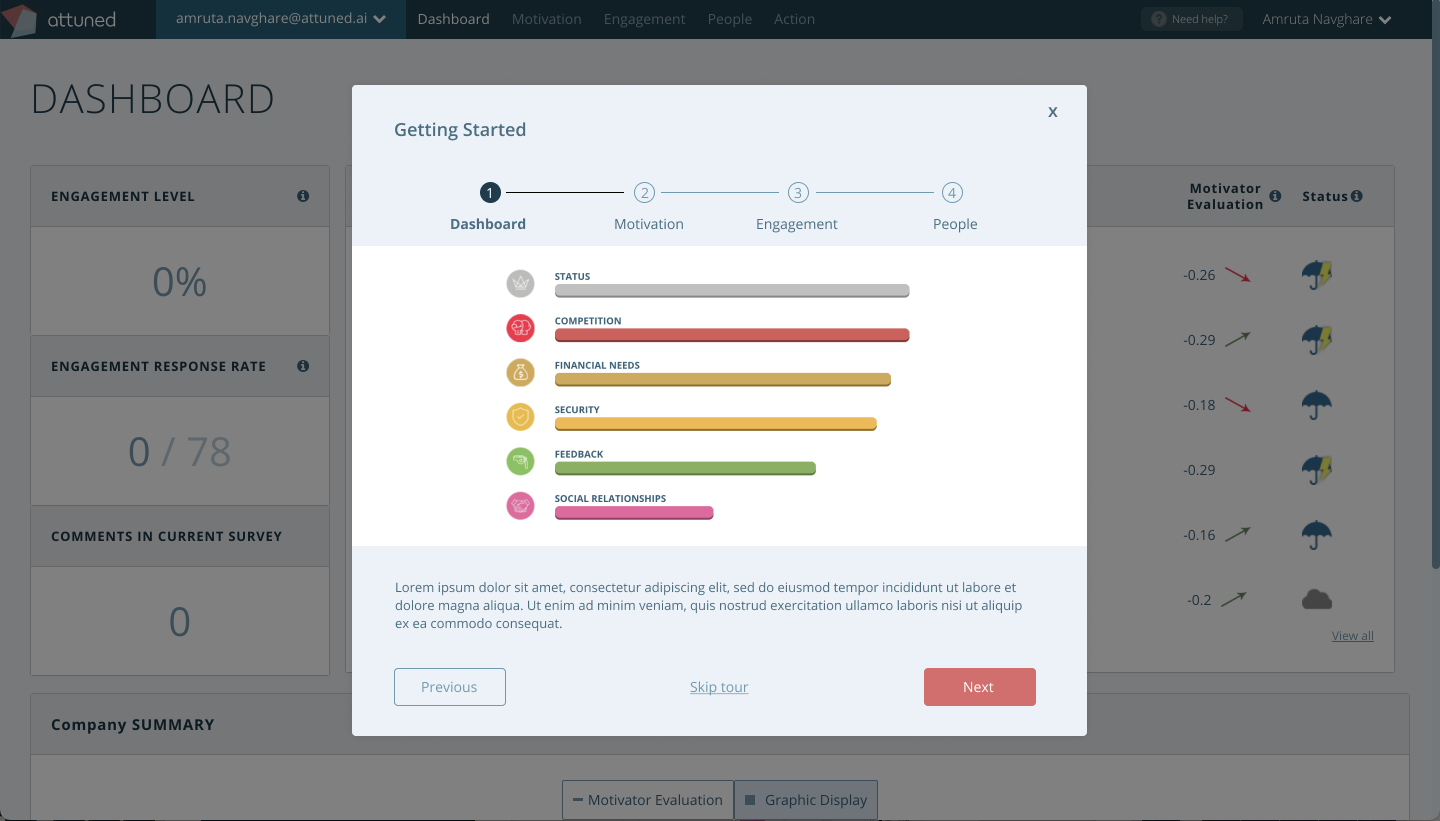
We will add a slideshow Tour to demonstrate which information the user can expect to see once they have enough data in the system:
Up to 10 slides depicting relevant screens filled with data will be displayed.
Available in Light Mode only, and in two languages (English & Japanese).
The slideshow can be started from any page by clicking on the ‘Take a Tour’ item in the Checklist.
The slideshow can be stopped at any point by clicking ‘Skip Tour’. It is not possible to navigate to, or click on, other pages while the Tour is open.